Cartographies of Invisibility
Introduction
Maps are not exact representations of reality, even though they are often presented as such. Neutrality does not exist in the production of maps, nor does it exist in their use; they are persuasive narrative elements with a strong communication purpose. Therefore, cartographies and maps have frequently been used as instruments of power and domination. They define the territory, draw its borders and resources, and consolidate the power of economic blocks. Societies have been shaped through maps, converting their citizens into victims of a representation that defines where and how they have to live. Cartographies are strongly related to technical and reliable knowledge, and the realities represented in maps are normally considered true, but their scientific objectivity should be questioned, as well as their intentions (Mesquita, 2016).
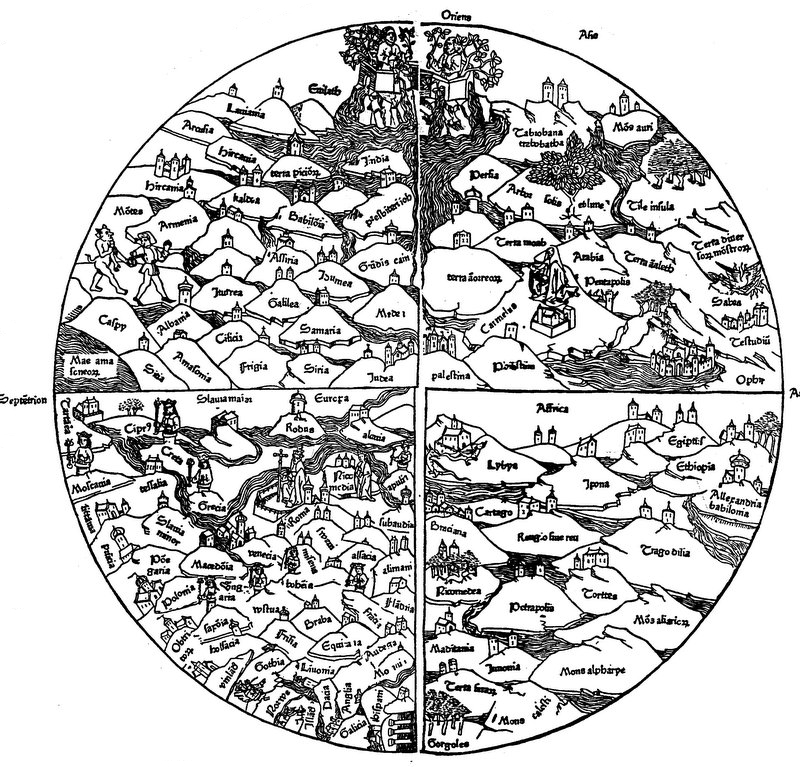
Fig. 0.1: World map from the Rudimentum Novitiorum.1
In the hands of capitalism and powerful institutions, maps have been utilised as an oppressive mechanism. They played a crucial role in the history of colonialism, when they were used to order and dominate the colonised. Furthermore, maps are considered an institutionalised practice that implies legitimisation of territories. Indigenous communities developed their own cartographies to put themselves in the maps and to defend their lands and rights. “More indigenous territory has been claimed by maps than by guns.” (Nietschmann, 1994). Indigenous cartography started to reverse map representations visualising their resistance and claims. Maps were converted into a vital inspiration for non-hegemonic worldviews and emancipatory practices.
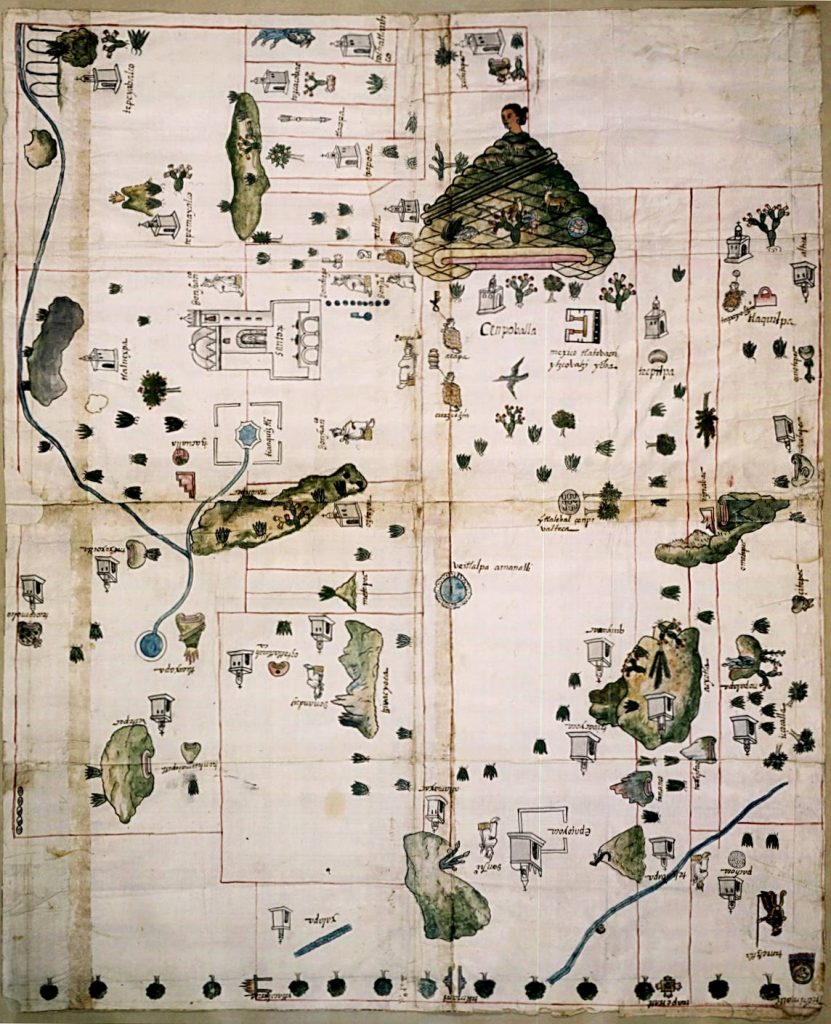
Fig. 0.2: Indigenous map, Cempoala, Mexico.2
Critical approaches to cartographies – deconstructing traditional maps and diagrams – have been explored by artists, architects, designers and activists in the post-colonial era. In the 1990s Nancy Peluso introduced the term “counter-cartographies” in her examination of forest resource mapping in Kalimantan (“whose woods are those?”). This project envisioned the effort of marginalised groups to contest land-use state maps that had long undermined their interest in these resources (Lin, 2010). Where official maps were blank, counter-maps told very different stories: fighting geopolitical power structures, exposing relations of domination over (and exploitation of) territory, and revealing networks of power and dominance.
Among the many kinds of critical mapping, this thesis focuses on counter-mapping actions, defining these as “any effort that fundamentally questions the assumptions or biases of cartographic conventions, that challenges predominant power effects of mapping, or that engages in mapping in ways that upset power relations” (Harris and Hazen, 2005). The counter-map rethinks the ontology of cartography, breaking the standards of geographic representation and visual communication. The counter-map becomes a disobedient portrayal, in which its own form and representation tell inconvenient stories that challenge the status quo. It is a free act of deconstruction of space and social phenomena, for which the protagonists allow themselves to pervert the most traditional conventions (Rekacewicz, 2019). The objective of counter-mapping is to suggest an alternative epistemology, rooted in social theory rather than in scientific positivism (Harley, 1989).
Drawings, maps and diagrams have been essential elements for me to think and to communicate with others. They are effective mechanisms to discover connections, and to visualise and raise awareness about hidden realities. Today, in a digital and globalised era, there is an urgency to question existing communication tools and find new effective strategies to engage with society. It is precisely because of the popularisation and accessibility of maps and diagrams that these are powerful tools for socio-political communication. There is a need for developing “science with people” rather than for people, especially in those fields characterised by “irreducible uncertainties and ethical complexities” (Funtowicz and Ravetz, 1993). Following the process of creating counter-maps, this thesis aims to address three main questions: what are the conceptual principles of counter-maps that make them different from traditional cartography? What is the power of participatory mapping in their production process? And how can we design post-digital dissemination strategies in counter-mapping?
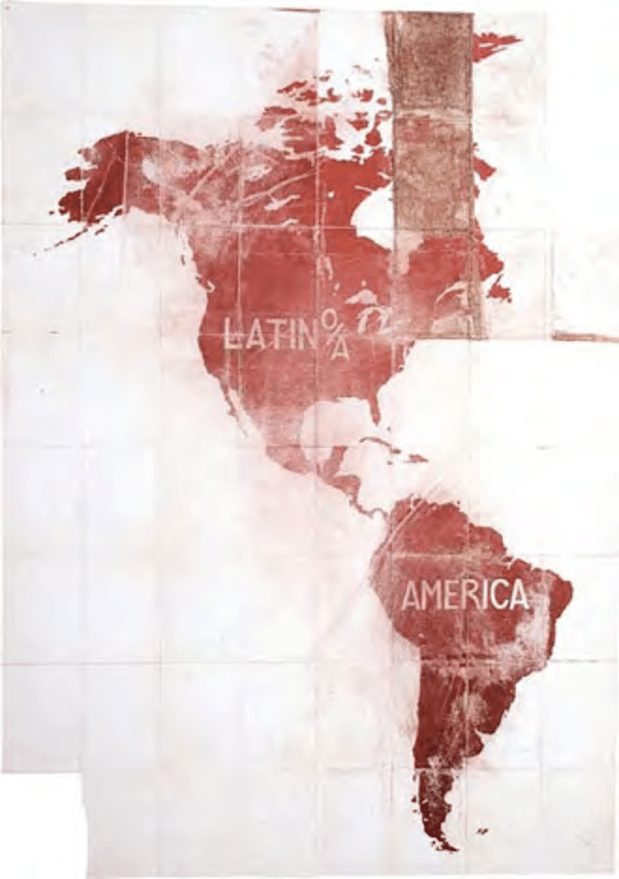
Fig. 0.3: Pedro Lasch’s Latino/a America, 2003.3
Chapter 1: Fundaments of counter-cartographies: the rule is that there are no rules
Counter-maps fight against impositions and conventions in cartographic map-making. They are documents which freely envision realities that are missed or misrepresented in “official” cartographies, finding new forms and codes to challenge these. This chapter is a reflection on how the basis of cartographic and visual representation is deconstructed by critical maps reformulating their fundaments. Counter-maps question geographical variables, providing an alternative view of the world and its representation. Furthermore, they democratise semiotic fundaments in visual language, and finally, they break the isolation of cartography as an independent discipline, thus opening a hybrid transversal area to explore through counter-mapping.
Deconstructing geographic authenticity
Mapping a territory implies an act of reinterpretation and reflection. “Map design can be thought of as mind design; the way a map is designed will influence the views of the world it stimulates or inhibits” (Holmes, 2004). Traditionally, the world map has been represented with a series of pre-established rules and protocols where the north is always up, and the most convenient projection is the Mercator world map. Nevertheless, the fact that we put the north at the top of the map and Europe in the middle is a result of the economic dominance of Western Europe after 1500. Noticing this representation means subverting the hegemonic, Eurocentric view of the world (Mesquita, 2016). A map does not have a privileged direction in space. After all, the Earth’s surface has no up or down, and no geographical centre. (Turnbull and Watson, 1993).
Every projection of the Earth’s sphere in flat representations implies a distortion. Therefore, no representation is any better than another, but merely a different set of translation codes and strong conventions from which it is sometimes difficult to escape. “Having been labelled ‘colonial’, ‘evil’, and ‘false’, the Mercator map is a monstrosity that just won’t go away.” (Prater, 2016). In 1876, the British writer Lewis Carroll wrote his poem The Hunting of the Snark which questioned the usefulness of the Mercator map, determining that the “perfect map” would be an absolute white document which encourages a completely free understanding of the space to represent.
“‘What’s the good of Mercator’s North Poles and Equators, / Tropics, Zones, and Meridian Lines?’ / So the Bellman would cry: and the crew would reply / ‘They are merely conventional signs! / ‘Other maps are such shapes, with their islands and capes! / But we’ve got our brave Captain to thank / (So the crew would protest) ‘that he’s bought us the best – / A perfect and absolute blank!’” (Carroll, 1876)
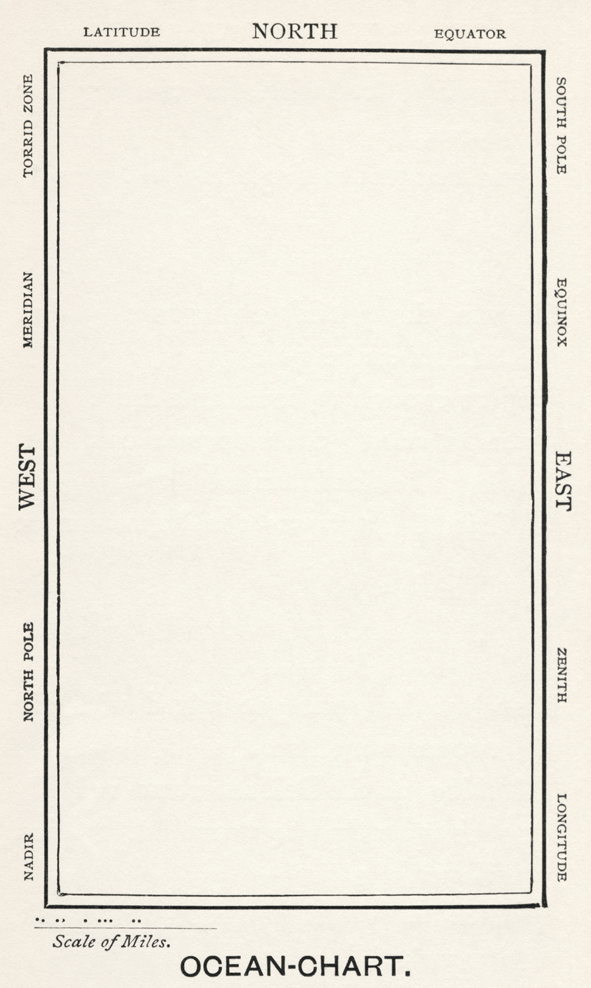
Fig. 1.1: Lewis Carroll, Ocean-Chart.4
The use of geographical alteration as a tool to strengthen the messages communicated in maps was also explored by the artist Joaquin Torres. In 1943, he published his work América Invertida which envisions Latin America upside down, reverting the traditional mindset by repositioning the south as the new north, under the slogan: “Our north is the south”. The resource is simple, and the effect is powerful. This act of counter-mapping was more than a mere rebellious impulse. It generated a new imaginary of South America and claimed a new position for Latin American art, previously considered “art from the south” and growing in the shadow of northern artistic practices produced in the United States. América Invertida created a fair idea of Latin America’s position in the world, not according to how the rest of the world positioned it but according to its own criteria.
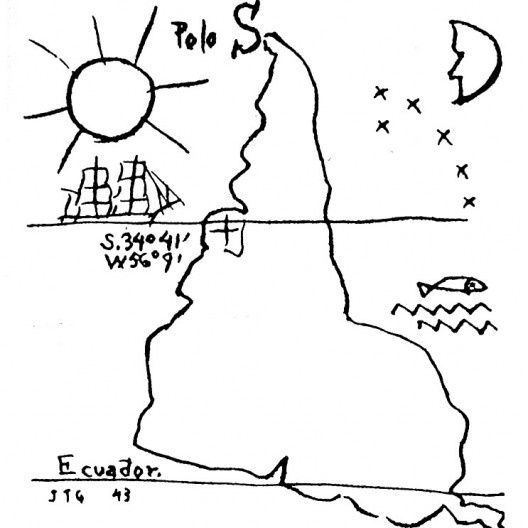
Fig. 1.2: Joaquín Torres, América Invertida.
Maps tend to draw the territory materialising its limits with lines. “A line is a curious concept. It indicates real or imagined partitions sometimes drawn to indicate imposed borders, timelines, ancestry, walls, and property.” (Cobb, 2015). Counter-maps release the linkage of the limits to physical realities or geopolitical authenticity, assigning the cartographer the capacity of interpreting, reshaping, or imagining their limits. An early sketch of experimental cartography is The Surrealist Map of the World (1929) which questions the preconceived idea that lines and edges define territory. Countries are reallotted sizes according to their importance to the overall Surrealist project (McCarthy, 2014). This representation deconstructs cartographic representation in three main directions: First, the Equator is not a straight line but an organic transversal path dismantling conventional mapping references. Second, England and The United States all but disappear (except Alaska), and the size of the islands in the southern Pacific is exaggerated – this may be related to the fact that they were believed to be the most capable of disrupting the rationalist hegemony of Europe (Wood, 2010). And third, the Pacific rather than the Atlantic occupies the centre of the drawing, thus banishing Europe and its ethnocentrism.
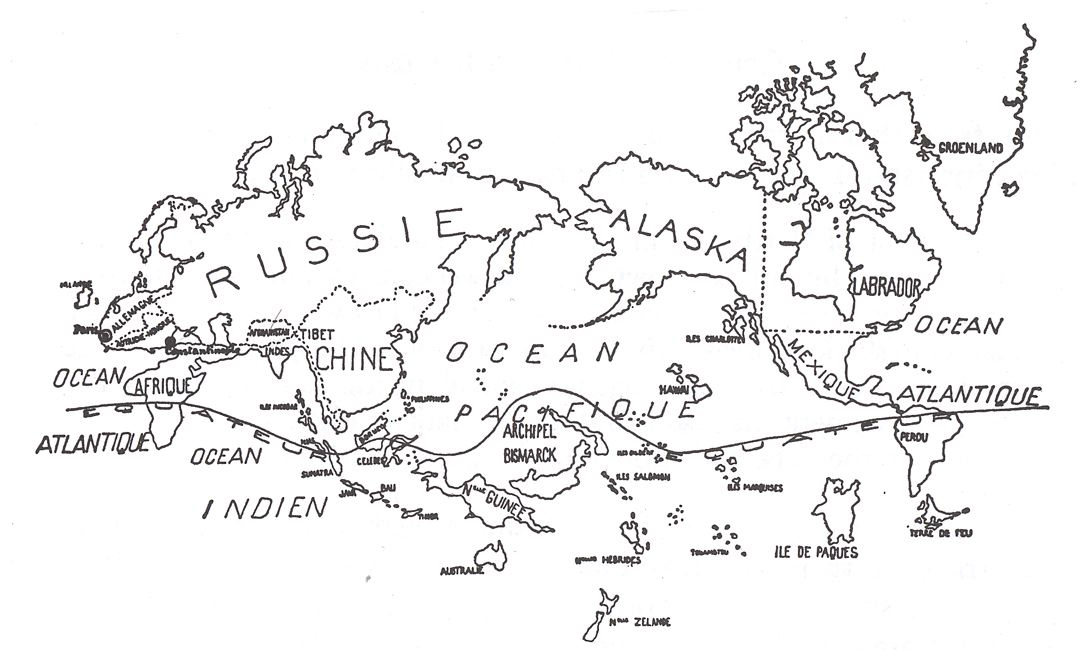
Fig. 1.3: The Surrealist Map of the World, 1929.
In recent counter-cartographies, world representation has also been frequently reinvented following the strategies of these pioneering examples. In 2008, the self-considered counter-cartographer Lize Mogel developed her work Mappa Mundi in which she reorders the world map based on the connection between places, their histories, and processes of globalisation. It represents improbable connections on the globe between the North Pole, San Francisco, the Panama Canal, the Northwest Passage, and ship-breaking sites in Pakistan, India, Bangladesh and China – finding links among these locations through international world fairs instead of geographical connections. Mappa Mundi was an exercise to visualise and represent hidden configurations that escape the hard edges of geographic borders.
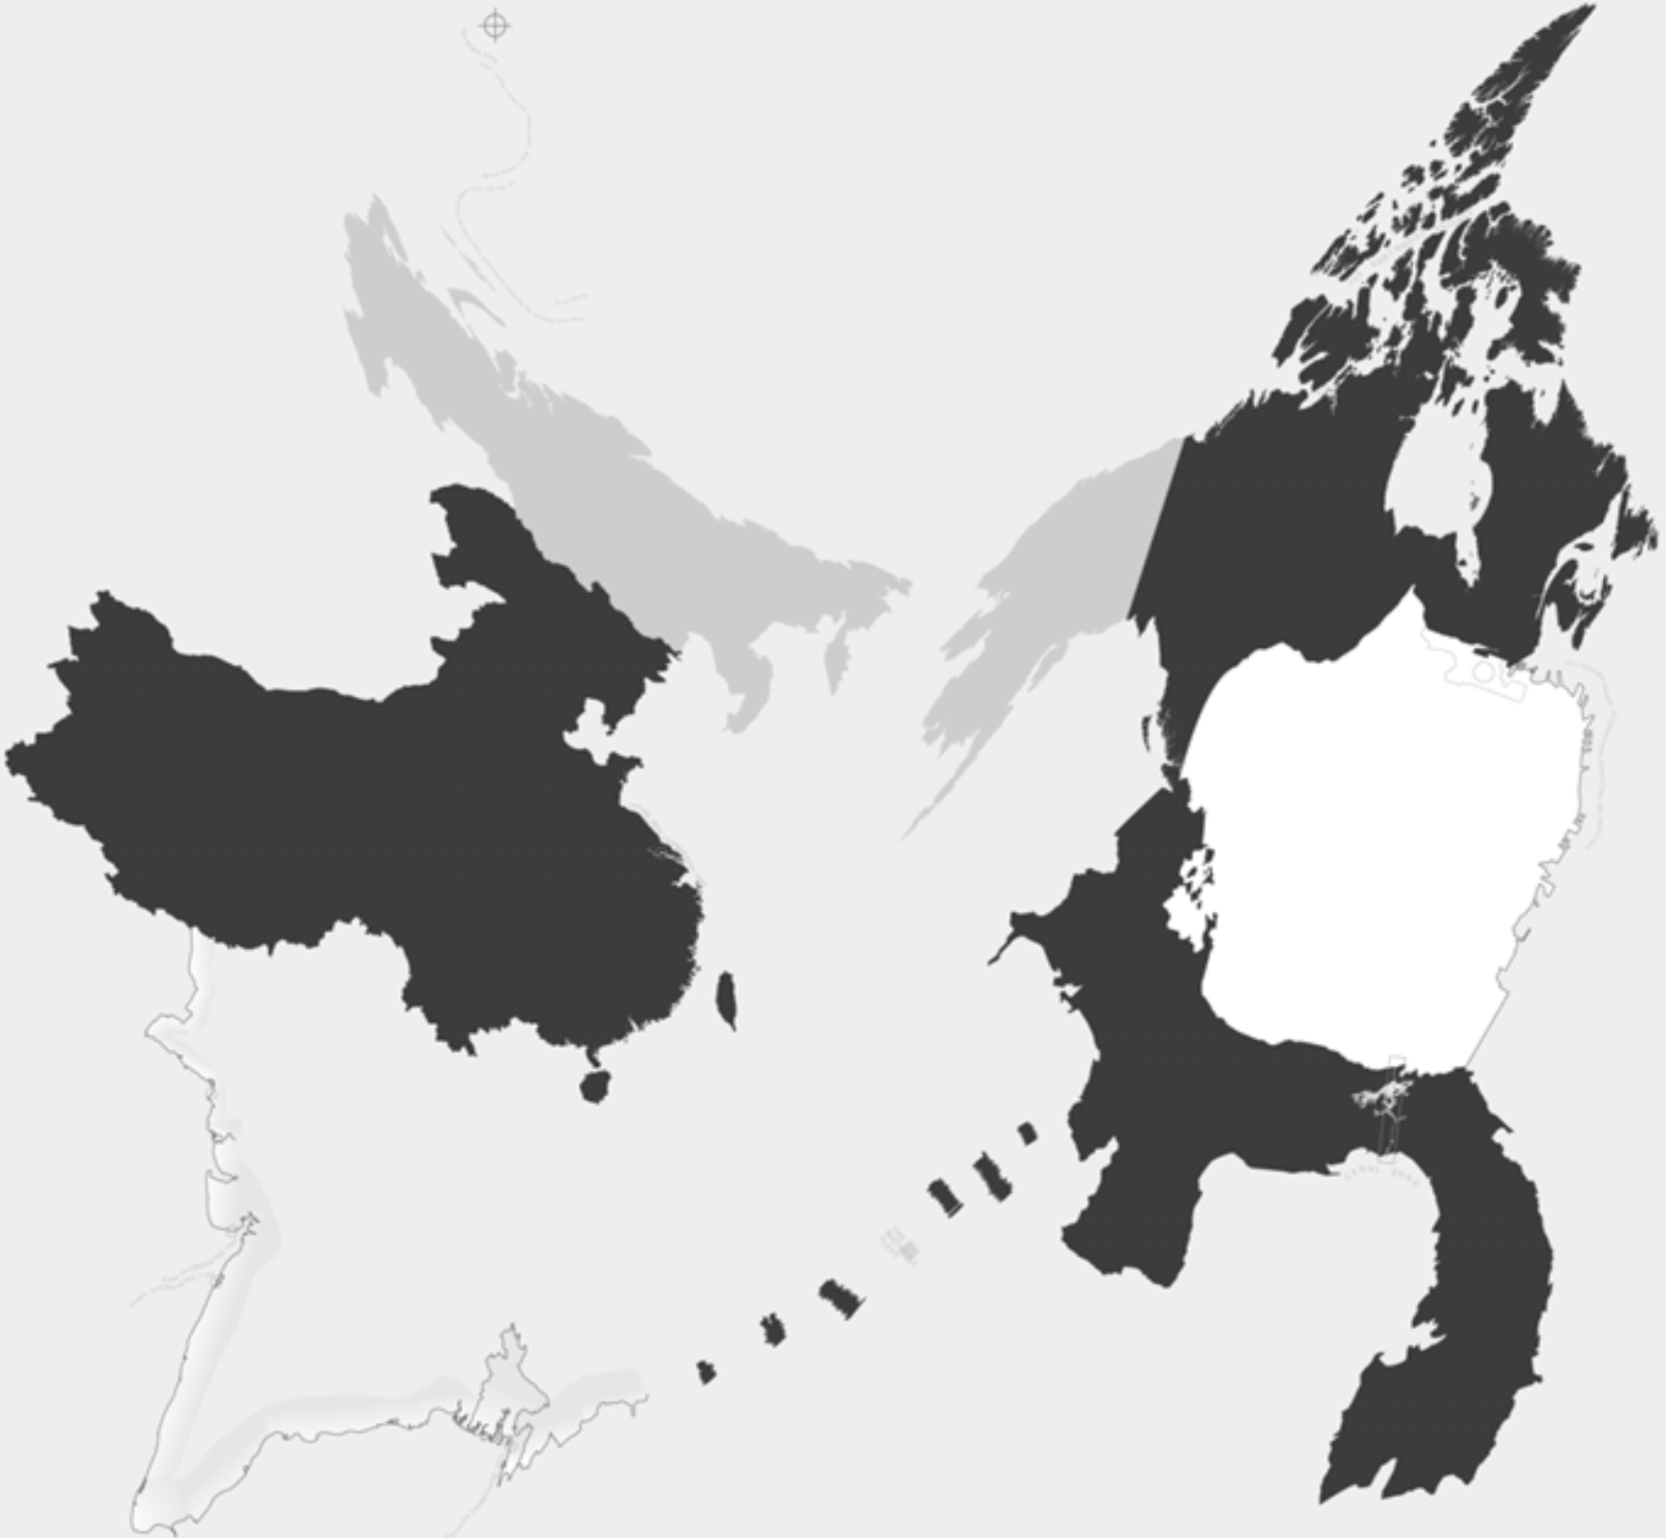
Fig. 1.4: Lize Mogel, Mappa Mundi, 2008.
The experimental Spanish architect Pablo de Soto created in his project Cartography of the Straits of Gibraltar an alternative understanding of the Spanish-Moroccan border region. In this project, the border is not an abstract geopolitical line but an increasingly complicated, contested space. The inversely oriented (north at the bottom) map highlights connections between southern Spain and northern Morocco to show a single region. These connections visualise the flows of immigrants, phone calls, products, etc. These flows are the inputs to reshape the very border into a border region creating insubordinate geographies. Doing so depicts and helps produce a different kind of edge than the crisp, abstract lines in a traditional atlas (Counter-Cartographies Collective, Dalton and Mason, 2012).
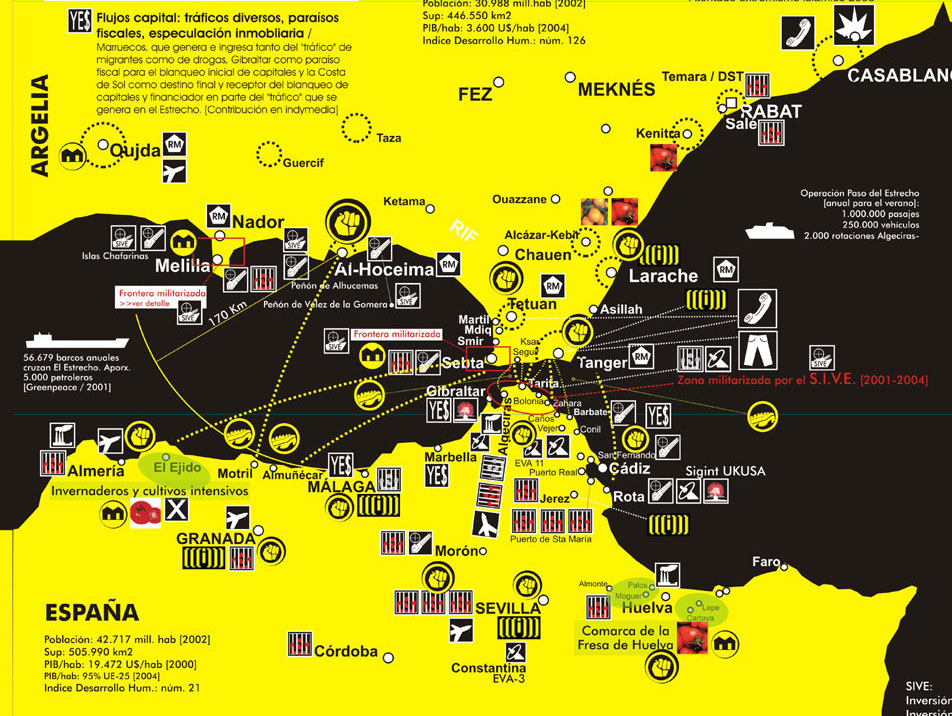
Fig. 1.5: Pablo de Soto, Cartography of the Straits of Gibraltar, 2004.5
Based on the strategies extracted from all these precedents in map-making, we can state that the purely geographical variable of cartographies can be denied in counter-maps to amplify social, political or economic realities. The Polish-American scholar Alfred Korzybski promulgates this in his best-known dictum “the map is not the territory”: counter-maps are not accurate representations of territory, but documents that generate alternative realities and produce new spaces. They are a dialogue between the imaginary and the real world. The map is a pale representation of the way we perceive the world. At the same time, geography brings here before us what is outside with clarity and accuracy (Ketchum, 2011) – a counter-map is a reflection on the world, no matter how faithfully or accurate, through some other person’s imaginative and interpretative act.
Towards visual democracy: rebuilding mapping grammars
Visual language plays a crucial role in mapping communication processes, building bridges between technique and understanding. The mathematician René Thom stated that visual codes are notoriously unstable, too imprecise to communicate knowledge with certainty. Visual images are not constructed using a given set of rules (Drucker, 2014). Still, this instability and the lack of pre-established regulations, allow map-makers to create proper and unique grammars. These are converted not just in a communicational element but into in the identity and personality of a community, considering the creation of democratic visual elements as an act of counter-mapping itself.
At the beginning of the 20th century, the German physician Fritz Kahn was a pioneer in the demystification of complex scientific ideas through innovative infographic grammar. Kahn found a language to visualise human body activity, decades before data visualisation and digital representation. He developed infographics that decoded medical jargon. Kahn created a diagram titled Man as an Industrial Palace, cut open to show cogs and pulleys, workers fuelling energy, meters gauging reactions, in order to explain how our bodies function. His representations are anatomic cartographies that provide an alternative view of the human body and popularise specialised knowledge. As the art critic Steven Heller writes: “After seeing the connections Kahn had made, it may be impossible to look at the human body or any similar composite structure in quite the same way again”.
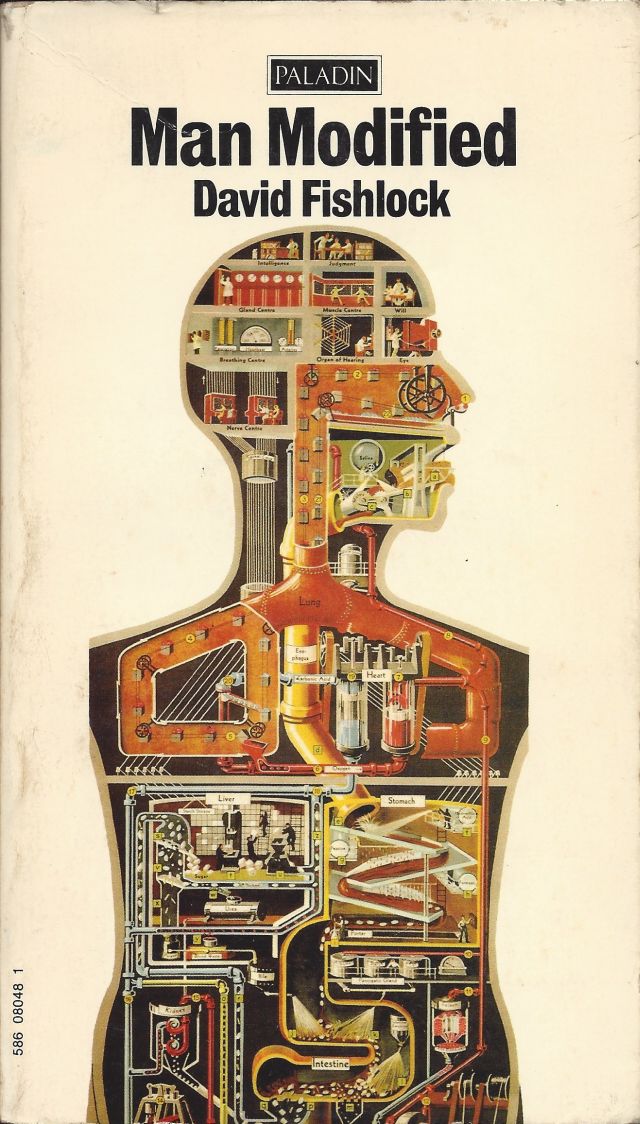
Fig. 1.6: Fritz Kahn, Der Mensch als Industriepalast (Man as an Industrial Palace), 1926.
After the First World War, the philosopher and sociologist Otto Neurath created the Isotypes as part of the social-democratic experiment known as Red Vienna. The Isotypes were a tool to communicate visually in a simple way: the cartographical outcome of the philosophy of “Gemeinschaft-Gesellschaft”, which aimed to bring community and society together. This system made data legible and accessible to non-specialised mass audiences (Vossoughian, 2010). Its role was crucial in raising awareness about the First World War. During the War, Neurath became director of the Museum of War Economy in Leipzig, which aimed to educate based on visual information. In 1924, Neurath initiated the development of the Museum of Society and Economy in Vienna, an institution for public education and social intelligence through visual displays. He was thus reinventing general graphic representation, creating both the space to share it with people and the proper codes to express this knowledge. Neither Kahn nor Neurath were visual designers: both were scientists, yet both fought to achieve innovative and democratic visual systems with social and popular value.
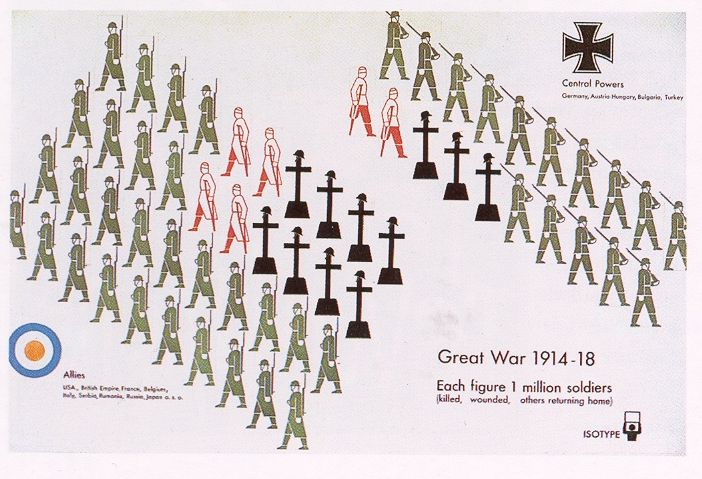
Fig. 1.7: Otto Neurath, Isotypes.
In the recent production of counter-cartographies, contemporary graphic codes have been constantly reinvented. For example, by the French duo Bureau d’Études, who generated for their book An Atlas of Agendas a specific pictographic grammar for visualising political and social conflicts. They created new visual symbols in the margins of globalised conventions. This grammar of invisible realities envisions actions such as mass surveillance systems, food contamination, human experiments, etc., and drafts connections among these in their widely disseminated world map diagram.
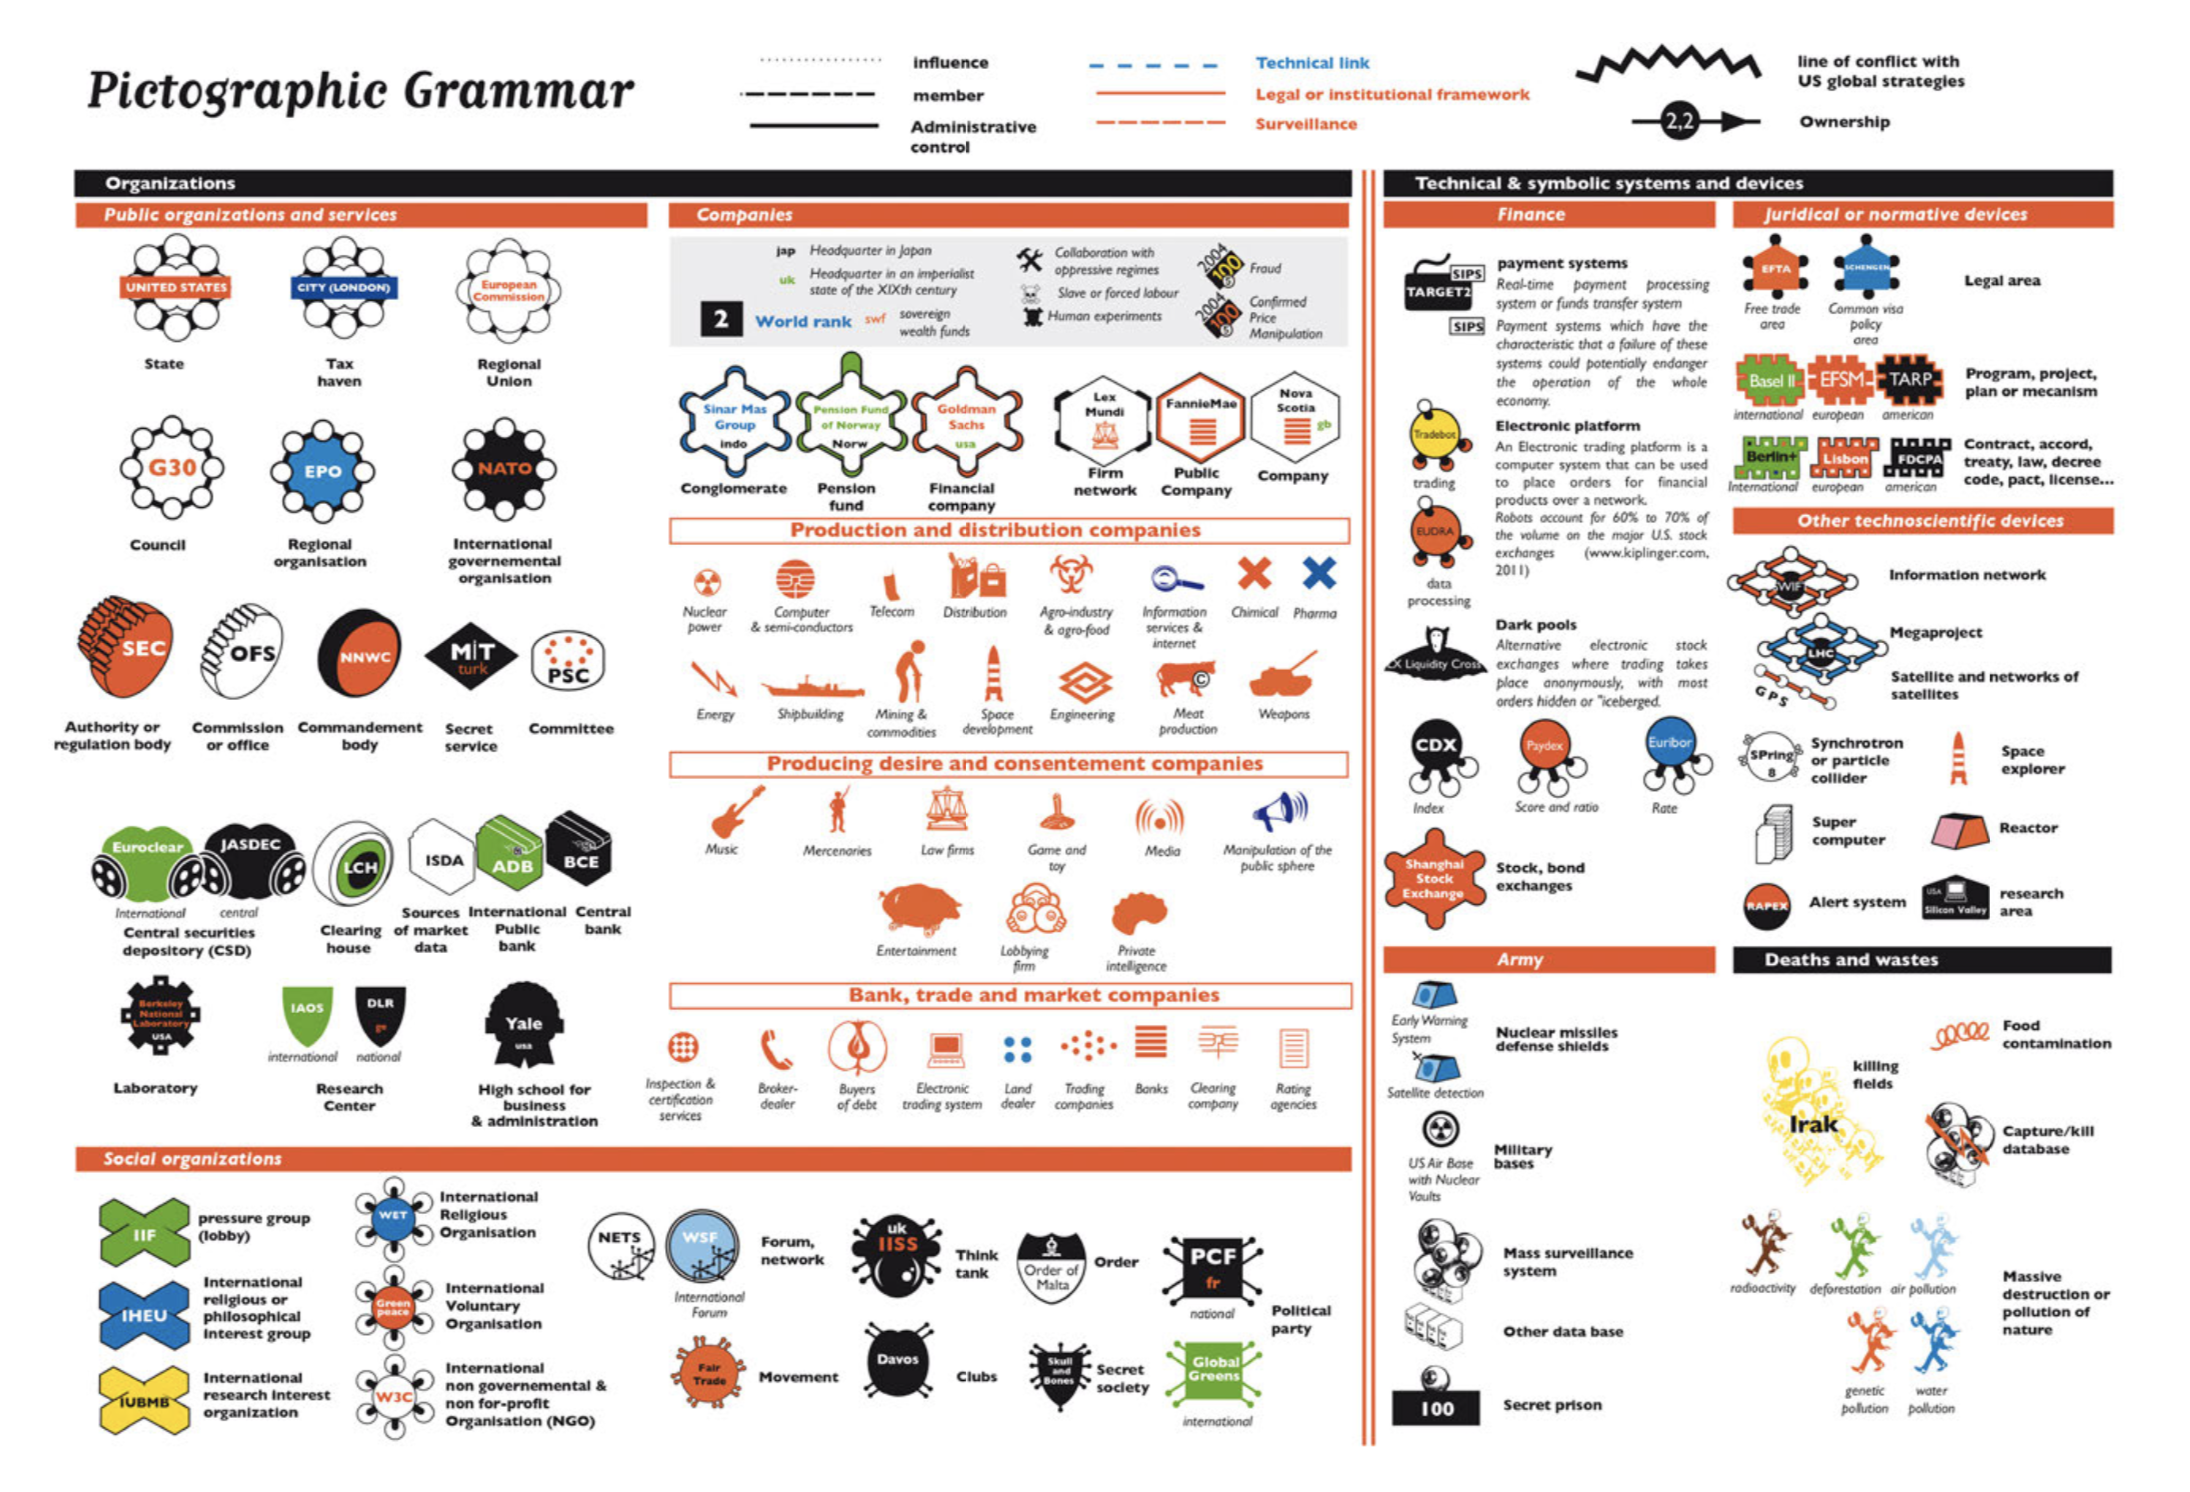
Fig. 1.8: Bureau d’Études, Pictographic Grammar for the world map.
In recent years, the Argentinian counter-cartographer duo Iconoclasistas have been working on the improvement of pictographic grammars to integrate into their critical narrations and collective mapping. They have built dynamic visual collections for community mapping in South America, in order to have a pictographic language that is continuously being updated. They have introduced collective working as a democratic tool to create ethical visual codes based on self-representation. The design and activation of an arsenal of visual resources (icons, pictograms, graphic and cartographic devices) establish a work platform that encourages the remembrance, exchange and signalling of themes. Iconoclasistas have based the graphic and visual support of their maps upon a strategy known as the “pictogramación”, defined as clear and schematic images that inform, signal and allow complex readings on various topics. They are built with drawings that represent emblematic situations and cases, making it possible to establish links, identify key figures, review practices, and make visible articulated forms of organisation and territorial transformation.
Cartographic hybridisation
Experimental practices in map-making were born at the intersection of several disciplines working together in the production of cartographic content. Counter-cartographies expand the disciplines that are present in map-making, aiming to build a hybrid and inclusive practice. They revert the isolated nature of cartographic representation and fight against monopolistic control of cartographies. Mapping impulses result from a convergence of several shifts in the way we think about cartography, representation and space. The challenge for counter-cartographers is to find a multidisciplinary space to work between psychology, geography, architecture, art, design, politics, technology and sociology.
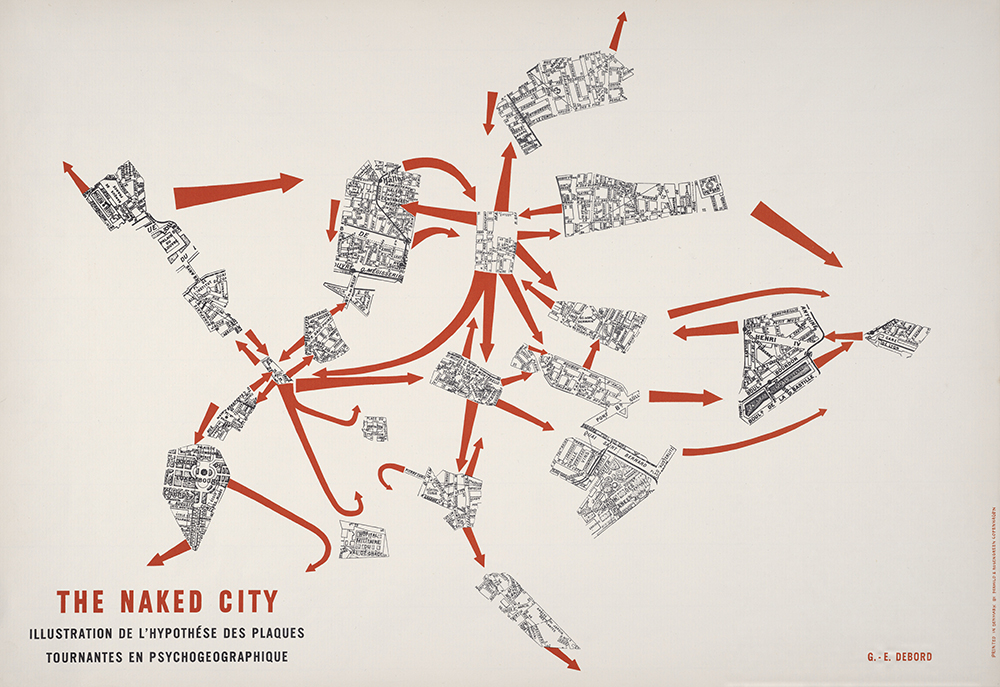
Fig. 1.9: Guy Debord’s The Naked City, 1958.6
After the Second World War, the French Situationist theorist Guy Debord introduced the term “psychogeography” as the intersection of psychology and geography. The representation of the territory was understood as a phenomenon based on perceptions and intuition rather than calculation. The Situationists were a shifting group of artist-intellectual-activists who would have rejected this description and were active in Europe between 1957 and 1972. They thought of what they were doing as “a revolutionary program… to confront the ideological totality of the Western world” (Wood, 2010). They were making cartographies for themselves, maximising the experiences that a person can have while walking without a destination in the city (a method known as “dérive”, which can be translated as “drift”). Situationist cartographers had to devise a form to capture the city’s psychological and social, as well as spatial, layout. The crux of a counter-map is not its representation of an actual, precise, or correct layout – the “real” maze, the “naked” city – but rather its representation of an imaginary relation to the complexities we inhabit (Morris and Voyce, 2015).
Ever since the Avant-Garde, Dadaist and Surrealist movements, cartographic culture and art have been strongly connected as an area of exploration through maps. The British Cartographic Society once proposed that there should be two definitions of cartography, “one for professional cartographers and the other for the public at large.” A definition “for use in communication with the general public” would be: “Cartography is the art, science and technology of making maps”, while the definition for “practising cartographers” would be: “Cartography is the science and technology of analysing and interpreting geographic relationships, and communicating the results by means of maps.” (Harley, 1989). The word “art” disappears when the definition refers to scientific or technical approaches, but is an indispensable element when cartographies are used as elements to engage with people.
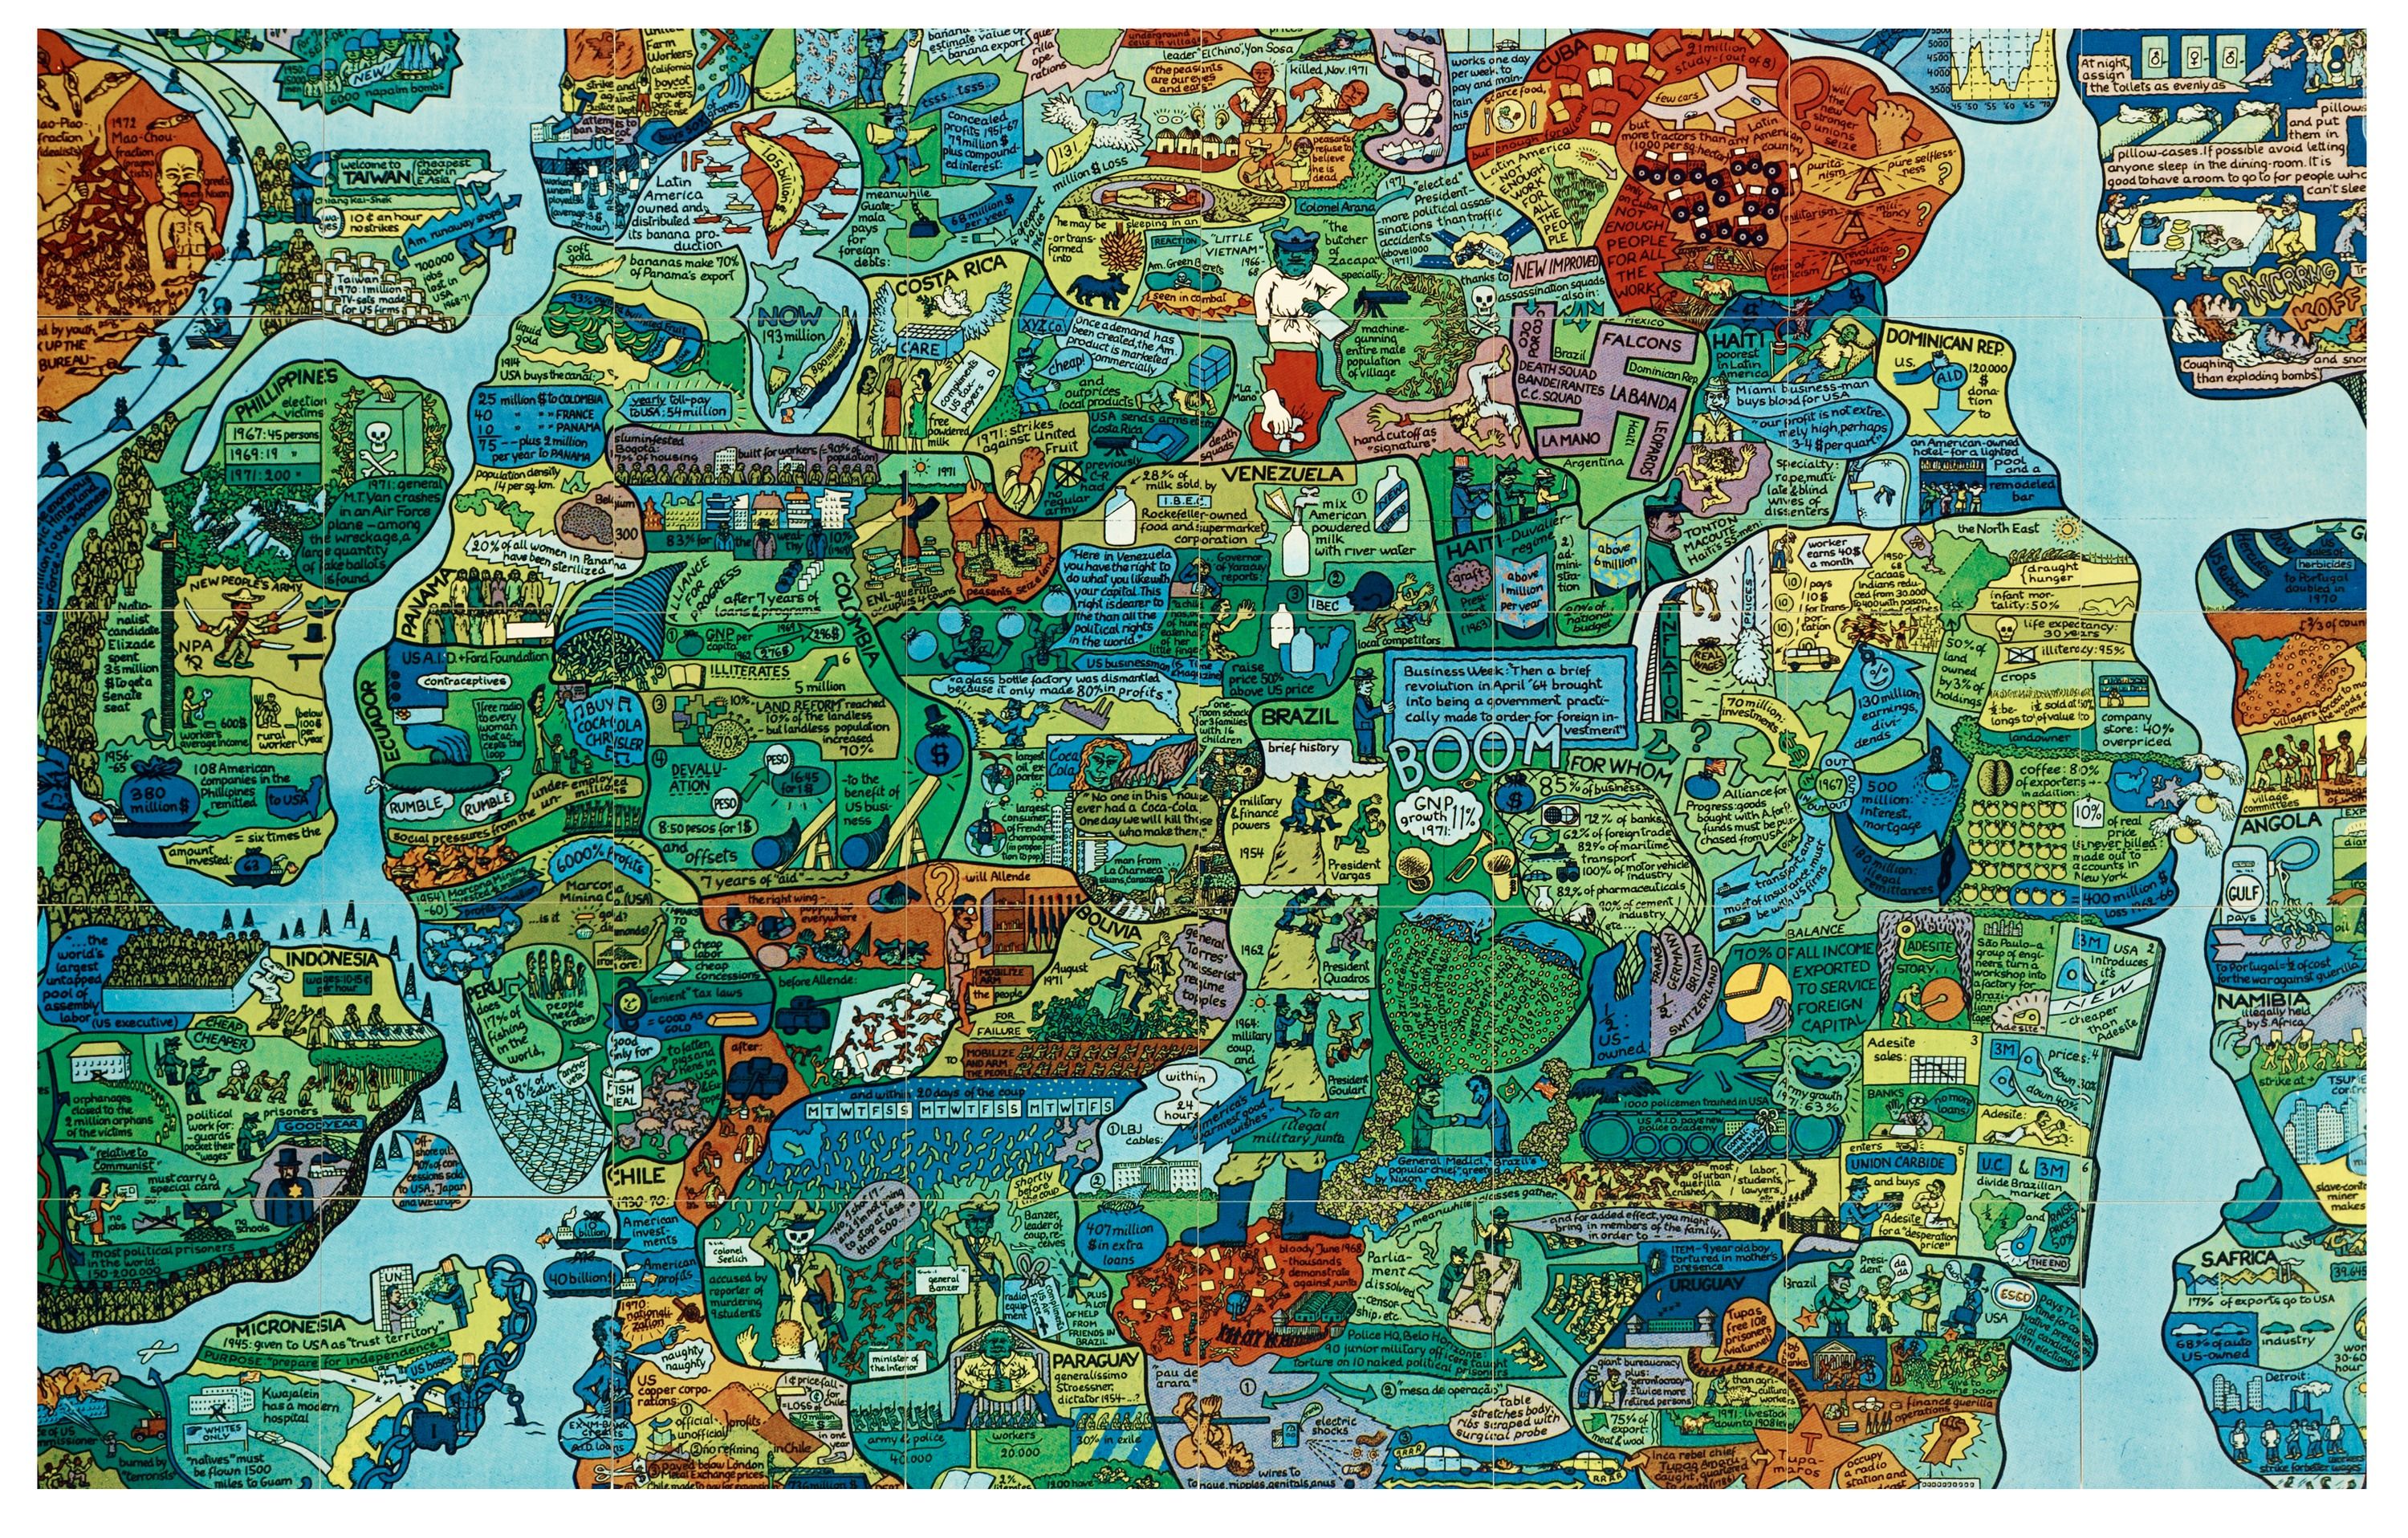
Fig. 1.10: Öyvind Fahlström, World Map.
The transformation of cartography by practices of art activism over the past decades has made it possible to explore alternative models outside of the academic context and beyond purely scientific activities (Mesquita, 2016). Öyvind Fahlström and Mark Lombardi are undoubtedly precursors for today’s counter-maps. Fahlström used methods from popular culture to critique and question cultural assumptions about finance, power structures and their representations (Watson, 2009). In 1972 he published his World Map, which challenges austerity in maps and visualises the instability of imperial power disputed between the United States and the Soviet Union. The activist nature of counter-cartographies reinforces the message: “This is the world you live in even though you may not see this” (Berwick, 2010). The American Neo-Conceptual artist Mark Lombardi also challenges the process of map-making, melting it with artistic and activistic practices. He has drawn hundreds of diagrams that visualise global political and economic networks of power. In the 1990s his worked focused on documented flows of information in political, economic and corporate power, showing data and connections in a network of links. His work’s narrative structures achieve a perfect equilibrium between art, counter-mapping and politics.
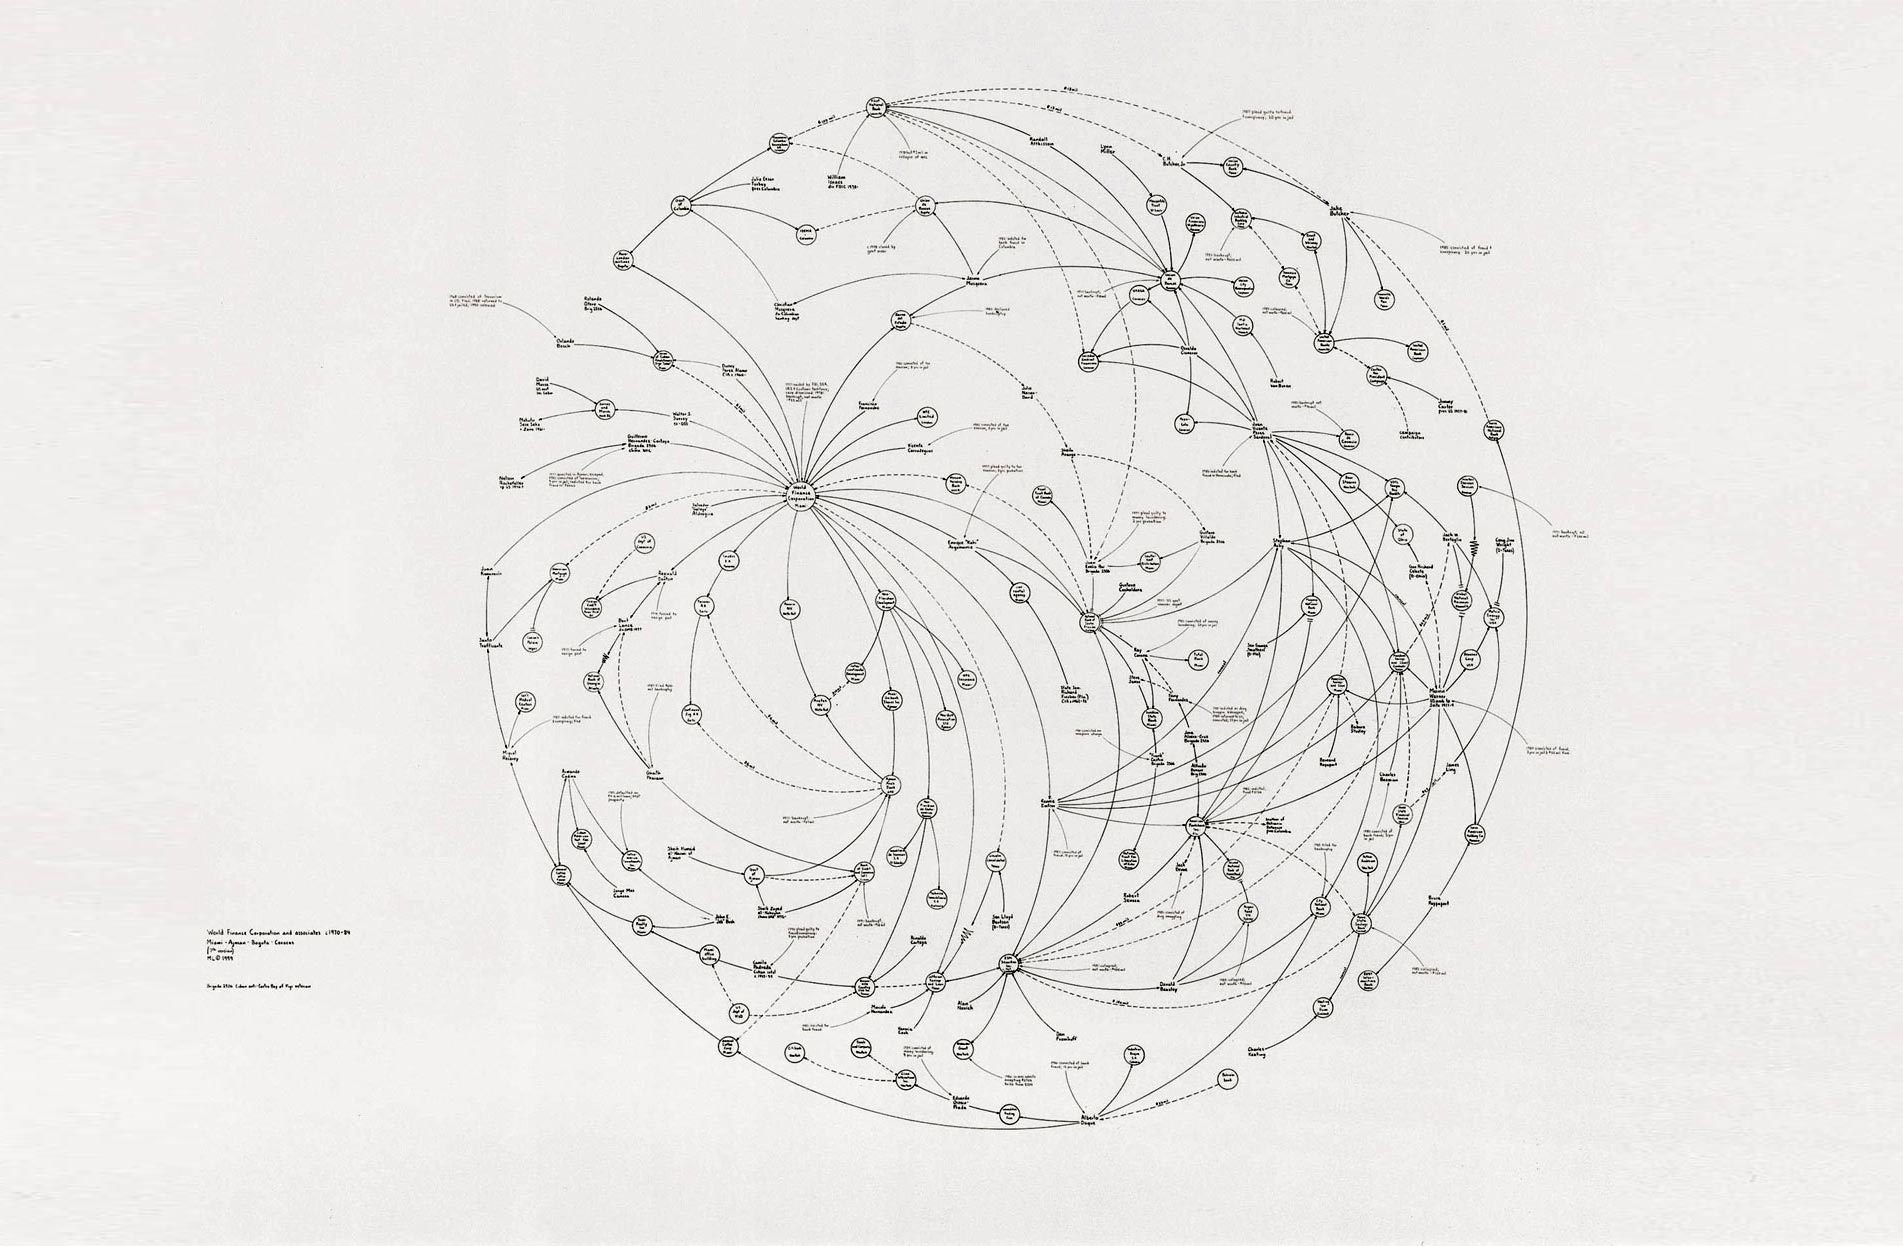
Fig. 1.11: Mark Lombardi, Chicago Outfit and Satellite Regimes.
The number of disciplines that can be intersected in the field of experimental mapping is as diverse as our mind can imagine. In recent experimental mapping, the scholar Christian Nold works on bio-mapping that illustrates the potential of mixing geographical technologies with biometric sensors, and helps communities create their own emotional maps (Perkins, 2007) – a collection of maps resulting from personal reflection between us, the environment and the citizens. As the data Journalist Mona Chalabi postulates: “It’s important that the visualisation itself reflects the subject matter and not just numbers”. Because there’s no such thing as emotionless data visualisation (Luv and Radburn, 2018).
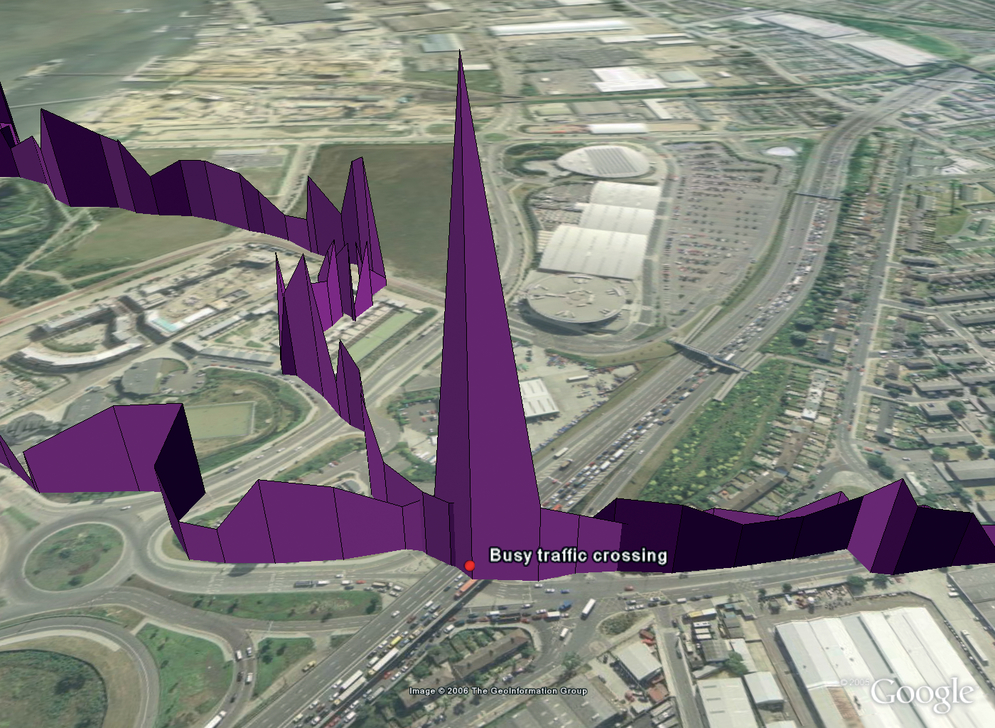
Fig. 1.12: Christian Nold, Greenwich Emotion Map.7
The task of the geographer is to alert us to what is directly in front of us, while the task of the experimental geographer – an amalgam of scientist, artist, and explorer – is to do so in a manner that deploys aesthetics, ambiguity, poetry, and a dash of empiricism (Scott, 2011). These crossroads between disciplines and languages have no standards to follow. Counter-maps are associated with several branches of knowledge and, at the same time, to any of these. Their multidisciplinary position frames counter-mapping in an area where the rules are still to be written.
Chapter 2: The power of co-mapping: legitimate, connected and autonomous counter-cartographers
“The critical or radical mapping approach is not only denouncing but also to act on the ground” (Rekacewicz, 2019). Crowdsourcing processes of map-making are opportunities to interchange knowledge; moments where cartographers and readers can go beyond their roles and acquire new positions re-designing hierarchies and structures. It’s not just the map which is the focus, but the mapping environment as a whole (a process, not a product) (Crampton, 2001). The process of collective mapping allows us to share and create reliable knowledge, establish relationships, and produce new autonomies.
Legitimate collaboration
Participatory practices play a fundamental role in the process of making counter-maps. They bring together distributed knowledge in a visual object representing a large number of voices and beliefs. The map is the transversal tool that generates support to legitimise all this variety of points of view of participants. For every official map there are two, five, twenty possible counter-maps (McCarthy, 2014). The necessity of participatory cartographies to achieve cartographic justice does not imply that maps have to include all viewpoints regarding space, but that many different maps coming from many different (ideological, geographical, social) places can and must co-exist (Blazquez, 2018).
In 2004, the American journalist James Surowiecki explained in his book The Wisdom of Crowds how the many are smarter than the few, and how collective wisdom shapes business, economies, societies and nations. Surowiecki argues that the assumption that, in order to solve social problems, we have to find the right expert individual who has the solution, is a mistake and is quite costly. Therefore, we should stop hunting for specialists and ask the crowd instead. Communities do not need to be led by exceptionally intelligent people in order to be smart. Even if most of the people within a group are not particularly well-informed, technical or rational, they can still reach a collectively wise decision. Counter-maps based on participatory processes of creation are more reliable, honest, and negotiated than cartographies developed by small teams. “The development of participatory counter-cartographies that involve the subjectivities of all those subaltern subjects who are less likely to be represented on maps is an opportunity to achieve cartographic justice” (Blazquez, 2018).
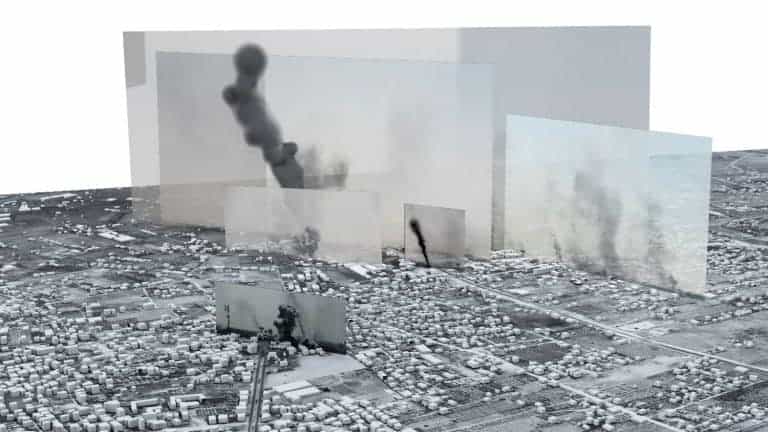
Fig. 2.1: Amnesty International and Forensic Architecture (FA), The Bombing of Rafah, crowdsourced map, 2015.8
Participation in the production of collective counter-cartographies is a voluntary act that implies an honest response of participation. The acronym VGI, coined by Goodchild, means Volunteered Geographic Information and refers to the creation of geospatial content collected and generated by non-professionals using mapping systems and creating a geospatial database (Caquard, 2014). This system is considered “the eyes on the ground” because even though the tools used do not have to be professional or scientific, the data collected includes unique local knowledge. This is an assertive method of collecting geospatial information, as opposed to the authoritative method employed by government agencies and private industry. The contributions that participants make to the map can have different natures; all of them are a legitimate input to the creation of crowdsourced cartography. You can directly enrich a map, editing the base content and adding your own information. However, you can also contribute by sharing information, so that other participants can translate this into the map, or with an indirect interaction providing feedback based on specific knowledge local to the elements that are already represented.
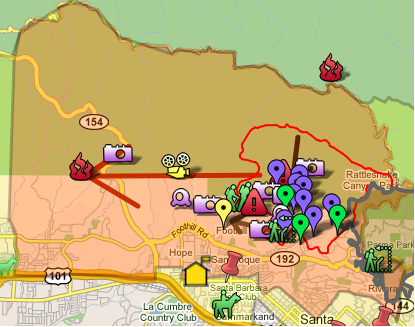
Fig. 2.2: Collaborative map of the Jesusita Fire in California, 2009.
Crowdsourced maps are elements for and by citizens who participate in the production of these maps, stimulated by a wide range of motivations such as idealism, local needs, or humanitarian reasons. One of the first motivations in the elaboration of crowdsourced mapping was “crisis mapping”, as we can see in the maps developed using Google My Maps after the Jesusita Fire in California in 2009, or the Ushahidi collaborative mapping platform in Port-au-Prince after the Haiti earthquake in 2010 (Caquard, 2014). This process of participatory mapping is a method to re-activate public agency in urban and social conflicts and to recognise the agency of users. “Community mapping legitimises a diversity of authors and images by altering technical and access barriers” (Parker, 2006).
Connecting values of co-mapping
The mapping process itself enacts a different form of knowledge production, which in turn produces new social relations and geographies. These experiences highlight the importance of collaboration, trust, and careful consideration of the social context and ethics of mapping research. It’s not only about producing new maps, but also about creating new forms of social organisation (Counter Cartographies Collective, Dalton and Mason, 2012). The process of how participants work together, negotiate, and make agreements regarding issues of place and representation, is as important as the map itself (Parker, 2006). The participatory production of maps is a social tool to generate citizen engagement and to establish links among map-makers. Workshops and map-making sessions are understood as laboratories and transdisciplinary spaces where negotiation and local empowerment are values to be developed through direct contact with participants in an ongoing dialogue toward reaching a common goal. Social theory is also connected to articulate the relation between social process and spatial structure – that is, how social forces become manifest in geographies, and how geography is constitutive of social relations (Dear, 2011).
A significantly successful tactic in collective counter-cartographies is to specifically focus on those maps that stress the importance of mapping local spaces by local people (Aberley 1993, in Kitchin, Dodge and Perkins, 2011). Among the many types of community maps, there is one collection that been particularly relevant in building links between communities through mapping: parish maps. Some of the earliest widespread community maps in the UK were parish maps, an initiative promoted by the charity Common Ground in 1985. The Parish Map Project was presented as an ongoing initiative encouraging local people to map what their own community valued, thus supporting local distinction. The mapping process was seen as being at once aesthetic and political, encouraging active participation in map-making – with the process, in theory, bringing together local communities to hold their own ground (Perkins, 2007). More than 2000 communities engaged in the production of local maps, which introduced a wide variety of topics on which to discuss, make decisions and fight to improve conditions at the local level.
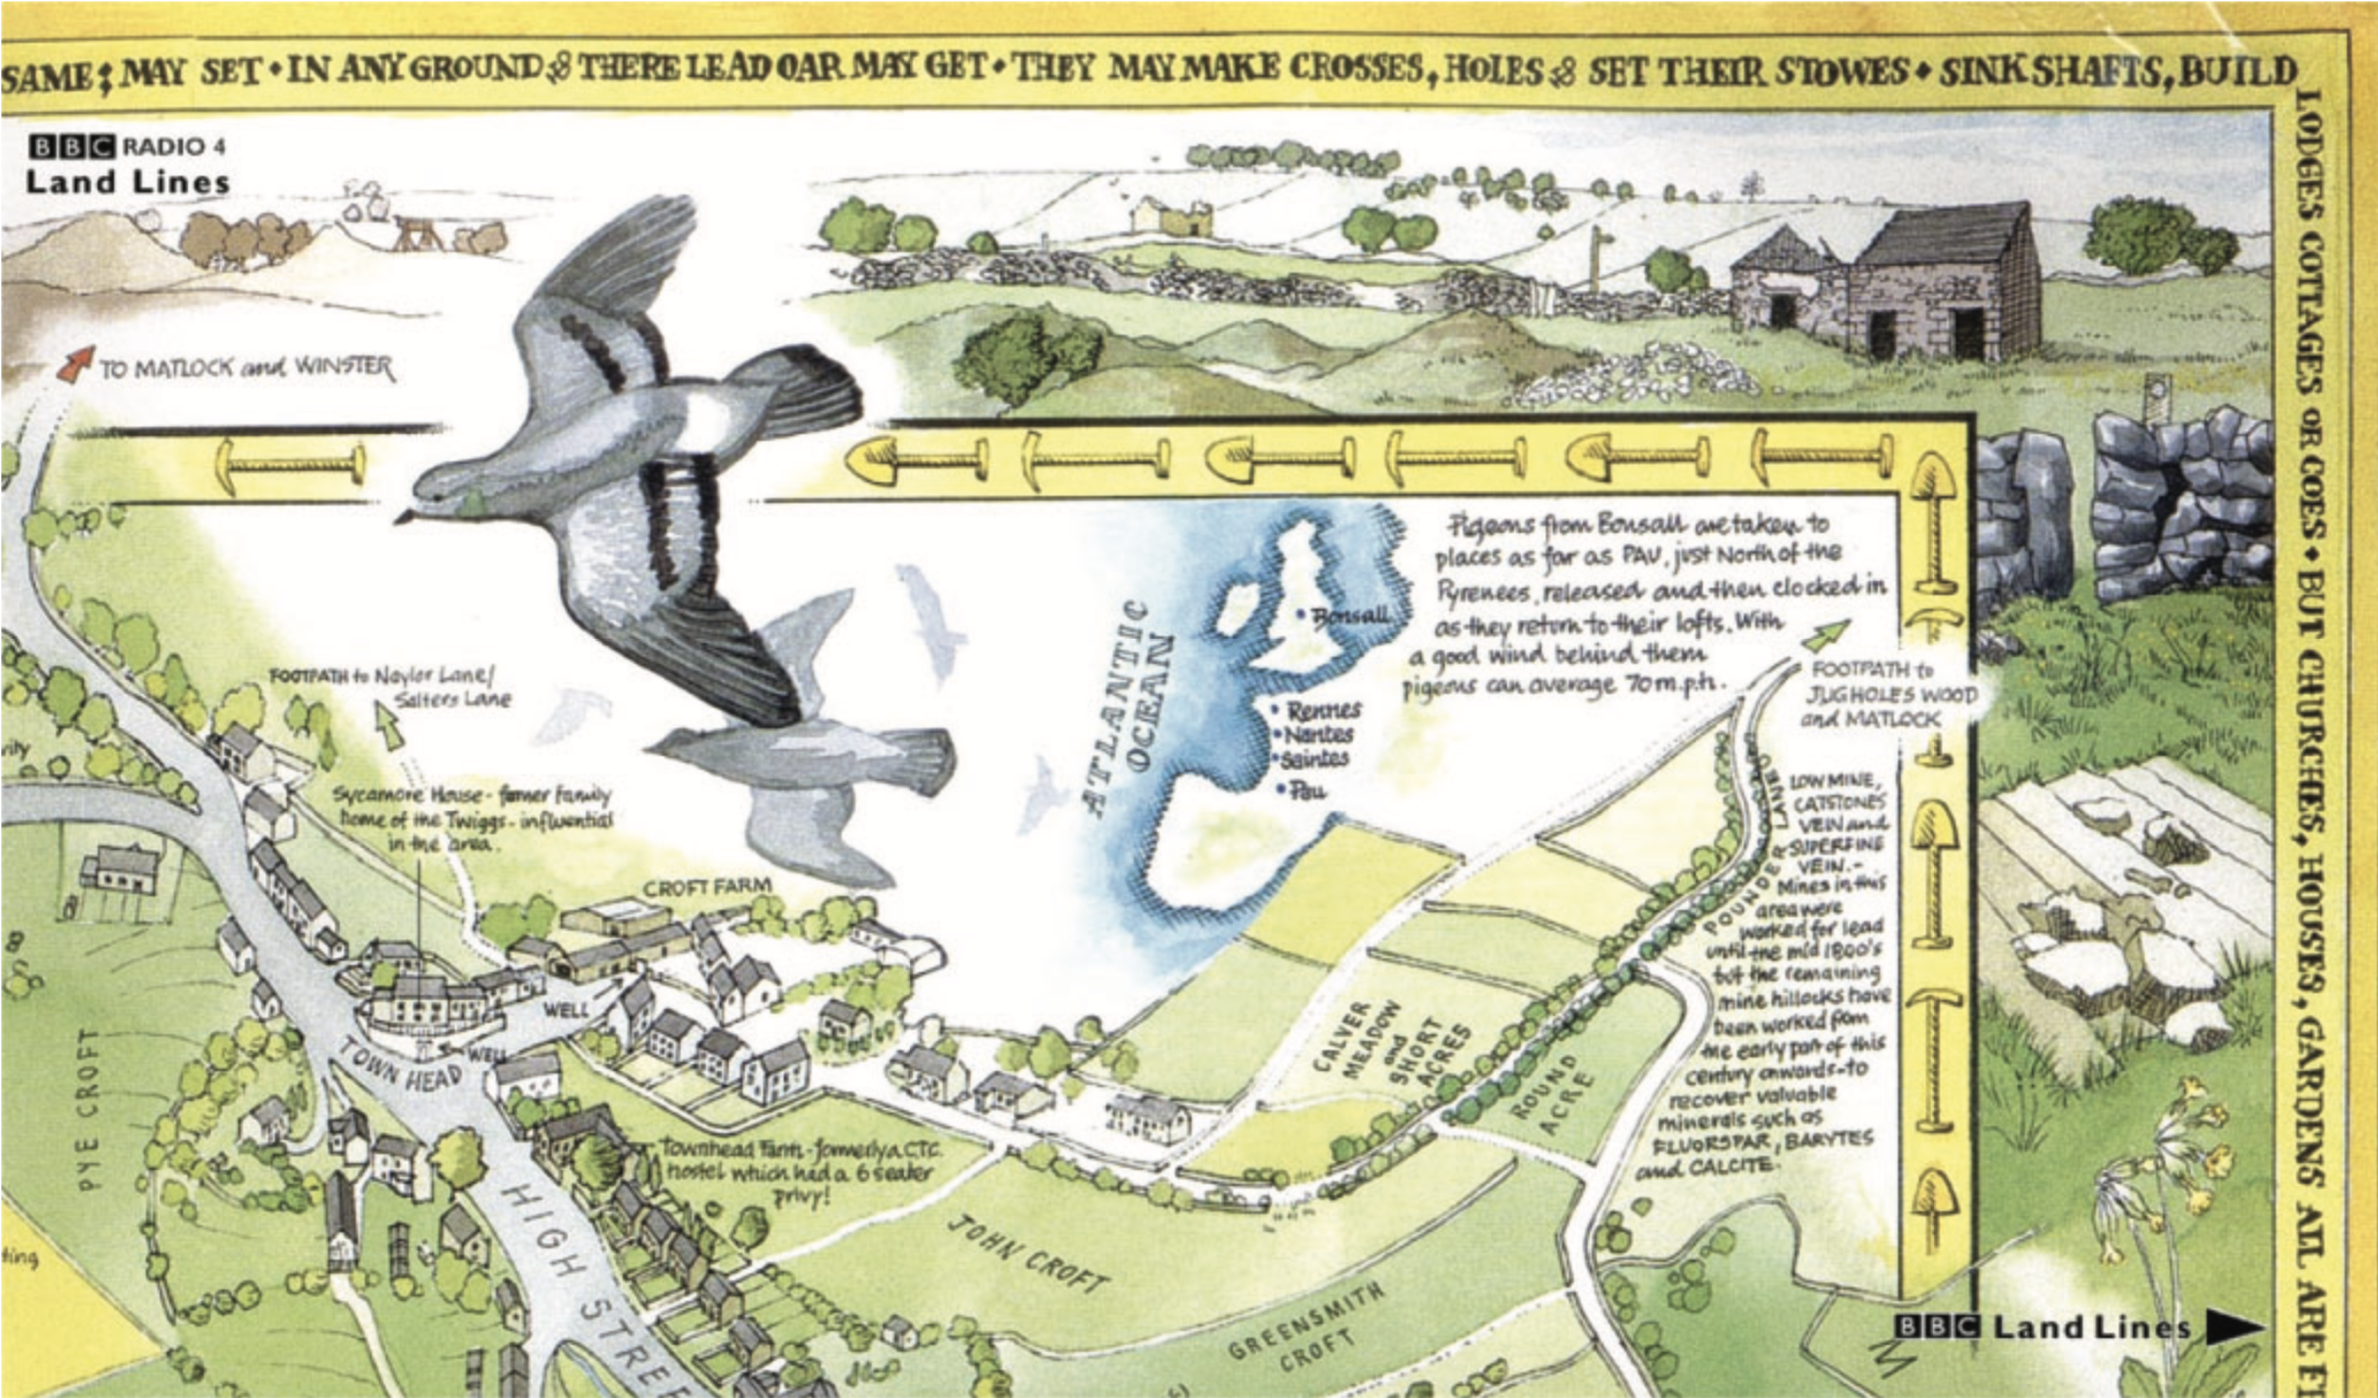
Fig. 2.3: Bonsall Parish Map excerpt.9
There are substantial knowledge gaps between audiences with different degrees of specialisation. It is precisely here that participatory mapping comes into value as a mechanism to build knowledge bridges. In 2013, Teddy Cruz and Fonna Forman developed the project “The Medellín Diagram” that triggered participatory democratic practices and collaborative urbanism. The goal of this project was to facilitate co-production of the city from the bottom up. One output of the project was The Diagram. However, the most enriching aspect was that collective mapping was used as a tool to connect people, to reconfigure social and economic relations, and to facilitate a re-thinking of public management. Collaborative mapping techniques were used as an urban pedagogical strategy that directly connects top-down and bottom-bottom knowledge through new interfaces and resources (Cruz and Forman, 2019).
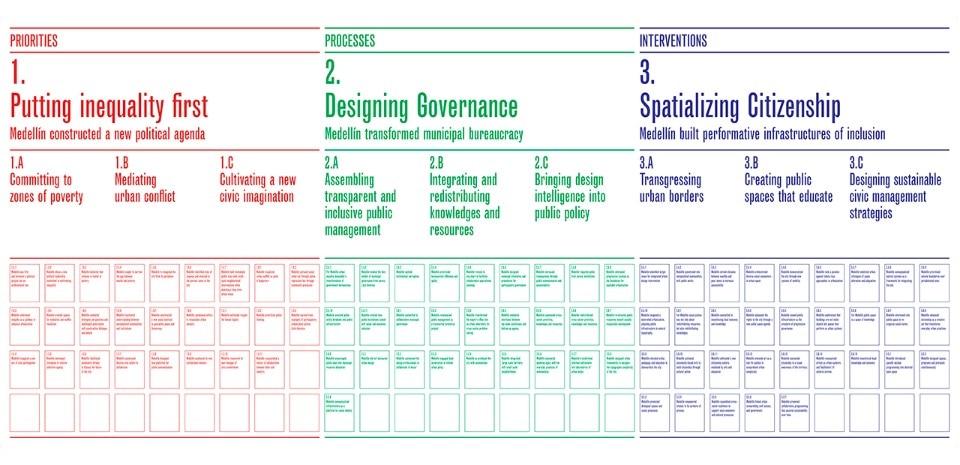
Fig. 2.4: Teddy Cruz and Fonna Forman, The Medellín Diagram, 2016.10
Although collaborative practices work better in local spheres where direct contact is exceptionally efficient, digital technologies allow us to connect people all over the world in seconds in the process of map-making. These instant connections have many beneficial consequences in counter-map-making. The Geographic Information System (GIS) is a compelling technology, but it also plays a role of social connector when it is further transformed into The Public Participatory GIS (PPGIS), leading to a network of community members who have power over GIS technologies. In 2004, Steve Coast created Open Street Maps (OSM), based on the successful Wikipedia model, where any user can edit any part of the map; OSM became a global digital platform to share geographic knowledge around the world and connect map-makers. OpenStreetMap is only as good as the contributions of the people who edit it. “Mapping parties” are digital social actions in OSM presented as events to get together to do some mapping, socialise, and chat about making a free map of the world and to strengthen digital or physical connections among contributors.
Become an occasional cartographer: the autonomous map-maker
All human beings can map: people have natural mapping abilities (Perkins 2007), although we generally don’t tend to consider ourselves cartographers. Counter-mapping opens up cartography to non-expertise map-makers. It asks participants to share their experience, their values, and their vision about a particular place (Parker, 2006). Tools, techniques, and technologies of cartography formerly restricted to “specialists”, are socialised and reinvented. They are shared freely and thus expanded to non-conventional uses. (Mesquita, 2016). As the artist and cartographer Denis Wood argues in the documentary This Is Not an Atlas (2019), anyone can control their own maps:
“Are the people who make Google maps cartographers in any way, shape or form? I can’t believe they are. I think they are computer guys writing code. If they are controlling the maps, you can control your maps.”
Since the 20th century, the term “neogeography” has been used to define the popularisations of digital tools and the autonomous practice of occasional cartographers, who have been creating collaborative maps and developing their own terms by combining elements of existing toolsets. This practice is strongly connected with the production of counter-mapping, where the cartographer is encouraged to develop their personal and self-governing practice. Autonomous movements influence counter-mapping production. We can associate autonomous counter-cartographers with Autonomist Marxism, which emphasises the resistance and autonomy of the working class. In this theory, the working class is the active agent, while capital is reactive. Autonomous cartography helps produce new, alternative practices, knowledge, and subjects (Dalton and Mason, 2012).
In 2016, the Bourj Al Shamali community decided to become autonomous cartographers, creating a collaborative map using a balloon mapping technique. At Bourj Al Shamali, a Palestinian refugee camp situated in Lebanon, the settlement’s 23,000 current inhabitants have never enjoyed the privilege of owning a detailed map of their 135,000 m2 grounds. The simplicity of the process also allows many people to participate. “This is not to say maps of the area do not exist, they do, only they are classified documents protected by local authorities and international organizations” (Savage, 2016). In Lebanon, refugee camps are considered areas too controversial to be openly mapped, so their distribution on Google Earth or physical maps is limited or inexistent; residents are deprived of control of their own geospatial reality. The creation of this counter-map allows them to have geographical consciousness of social and urban problems and to fight for improvements in the area.
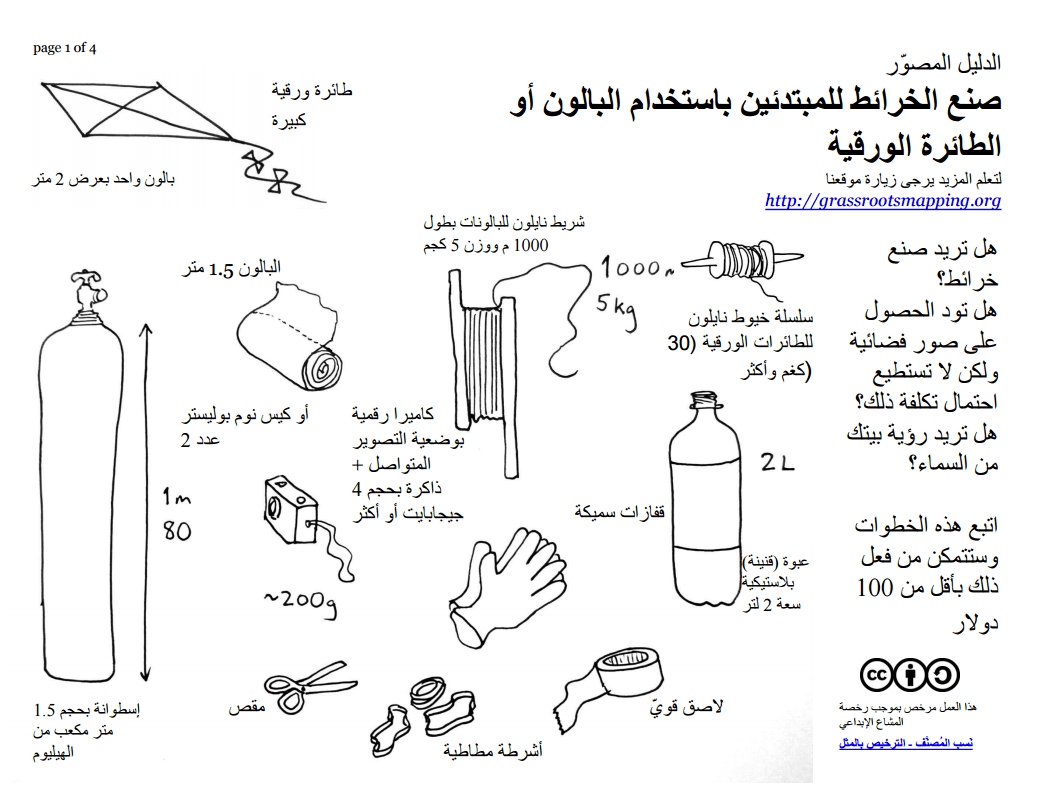
Fig. 2.5: Balloon mapping guide for Bourj Al Shamali.11
The elaboration of crowdsourced counter-maps has encouraged the production of manuals and guides of map-making, but how can autonomous cartographers be trained without compromising their autonomy? Such guides do not define a path to follow as a counter-cartographer, but instead break barriers facing counter-cartography. The guide Manual of Collective Mapping designed by counter-cartographers Iconoclasistas, removes the fear of producing maps, breaks technical barriers, and provides inspirational references. The difference between mapping manuals and counter-mapping manuals is that the mapping guides define solutions, while the counter-guides launch unanswered questions – putting the reader in a critical and richer position when facing the development of a map. “The co-production of critical knowledge generates rebellious bodies. Thought about rebellious practices gives value and power to those practices” (Malo, 2007, in Dalton and Mason, 2012).
Chapter 3: Activation and propagation of counter-maps in our post-digital era: giving society its knowledge back!
Counter-maps are only as good as the degree to which they are circulated. A map that no one sees is barely a map. Visibility and circulation are crucial aspects of map dissemination. The popularisation of mapping tools facilitates accessibility to readers, but also generates an overwhelmingly mapped society. This requires a re-design of communication strategies that combine activation, engagement, and readability – as the artist and geographer Trevor Paglen explains in an interview with Michael Dear (2009):
“We don’t spend enough time worrying about opening up spaces for communication. And we have to learn how to communicate beyond expert circles. Some ideas are complex and complicated and difficult to explain, but too many times, we let our language and jargon get in the way. If I can’t explain something to my dad then I feel I’m not trying hard enough.”
The communication of counter-maps is not academic navel-gazing, but something much more important: an effort to reach a broader audience. Since geographic concepts are so important to the public sphere, old geographic concepts have to be rethought, revolutionised, and in some cases simply exploded to make way for new thinking. (Lewis and Wigen, in Ketchum, 2011).
Counter-narratives
Counter-maps go beyond the visual object (Mesquita, 2016). They are not query documents, but mechanisms to stimulate free and critical thinking. Like reading a graphic novel, the main goal of literary cartography – as synthesised by Moretti (1999) – is to rearrange the components of a narrative in an unexpected way, in order to bring to the surface hidden configurations, which in turn explore non-linear and experimental narratives. There is not a correct way to read counter-maps; the reader closes the circle of production. For the cartographer and map historian John B. Harley, maps are socially constructed texts, and as such, can be interpreted in multiple ways, can have contradictions and fragmentations, and cannot be traced back to a sovereign mind or subject (Crampton, 2001). Counter-maps employ ambiguity – not to muddle matters, but on the contrary, as a means to activate their public(s) and to provoke new ways of seeing and actively participating in the world (Scott, 2011).
In counter-cartographies, what is represented on the map is as important as what is not, to be generated by the reader’s imagination. The positive reaction appears to be based on the ability of the map to engage audiences instinctively and emotionally (Moss and Irving, 2018). The deconstruction of conventionalism urges us to read between the lines of the map (Harley, 1989) and to extract our personal interpretation, developing a deeper connection and engagement with the cartography. “A good map stimulates the imaginations of users who invent road trips, battles, and love stories as they follow the long spindly highway lines and pools of blue water” (Berwick, 2010).
In the 1970s, the Czech geographer A. Koláčný established a basis upon which maps are no longer understood as mere information display elements, but instead as a communication system that requires its own narrative rules and rhetorical figures (Mesa del Castillo, 2012). This statement, known as the “map communication model”, can be understood as a starting point to open up toward alternative narrative strategies and elements in map-making processes. It considers the abilities and psychological process of the reader and user as communication variables. However, it is desynchronised when we talk about counter-mapping.
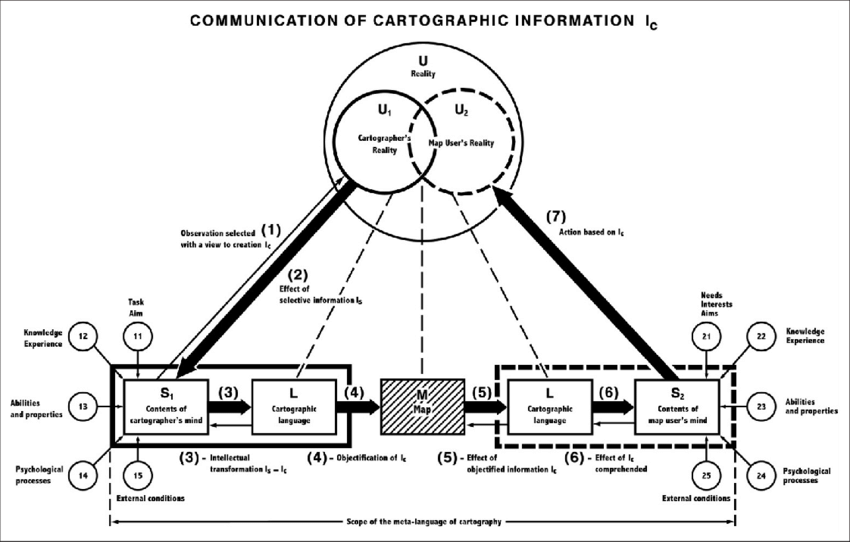
Fig. 3.1: Koláčný’s map communication model.
Koláčný defines a clear separation between the cartographer’s and the user’s reality in the communication process. Nevertheless, the perception of the user’s and the cartographer’s truth can be understood as a unique entity in counter-maps, or strongly connected through a process of sharing knowledge and goals, enlarging the common ground between user and cartographer. The map is presented in Koláčný’s model in the middle of the communication process, as a punctual information exchange element. In counter-cartography, the map is a continuous component that is always supporting the process of communication and is evolving in different phases. Finally, the method of communication is presented as a unidirectional circle where the cartographer transmits information to the user through a particular meta-language. However, this interchange of information is transformed into a bidirectional process in counter-cartographies, where the cartographer gives information to the user and vice versa.
Format crisis: it’s time to explore the output
Publishing anything has never been so easy and fast as now. We can post a map online with just one click in a few seconds. As a result, we have more maps distributed on the internet than we can process in our lives. Online tools are powerful, but publishing a map digitally is not enough to make it work. On the other hand, physical publications have traditionally been the primary medium of maps and cartography dissemination, but the efficiency of physical publications is deeply questioned nowadays. How then can we enrich our outputs to make our counter-maps effective and fruitful? There is a considerable urgency to reinvent the format and discover new mediums for knowledge amplification. We should keep asking, in our map projects: “What form(at), or medium, most fittingly represents my subject? What will particular formats allow, or not allow, me to convey?” (Scott, 2011). The most exciting tools for map amplification live somewhere sparsely explored between online and real space.
The audience becomes a remarkably dynamic entity in counter-mapping communication processes. It is worth asking how we can use this human presence and the body’s capabilities to intensify the dissemination of counter-maps. The artist Lize Mogel, in her project Performing Infrastructure (part of a larger project titled Walking the Watershed) explores the relationship between New York City and distant places that supply the city’s water, and makes this exploration visible to citizens. Mogel studied opportunities for embodying diagrams in a workshop, in which participants represented the infrastructural water system. Arms and hands became connections of the diagram; bodies became nodes, and clothes were converted into diagram variables. This lively display, based on socio-spatial human relations, activates the public to magnify the message behind the map: to envision water as a social connector.
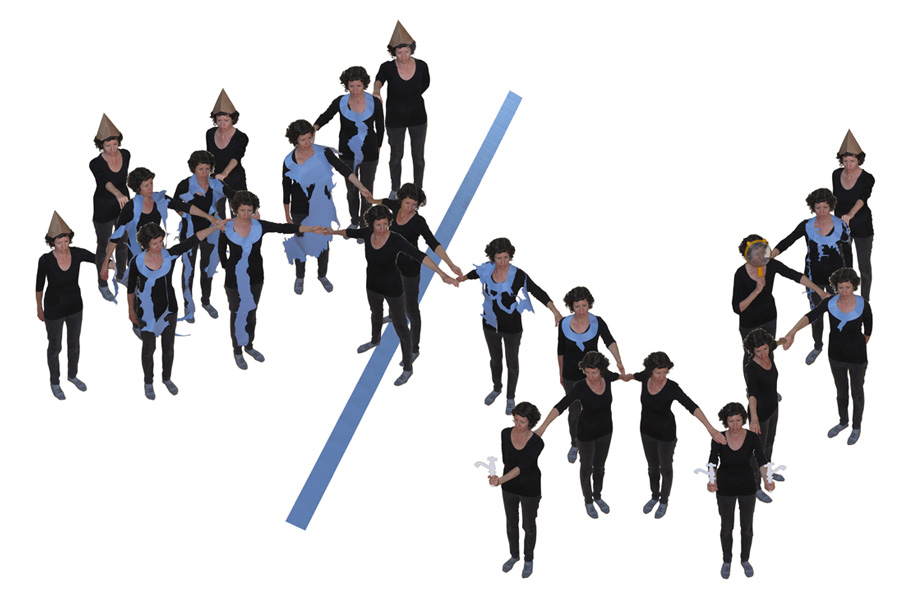
Fig. 3.2: Lize Mogel, performance of New York City water supply.
The relation of cartographies and space is irrefutable in its representation, but maps are rarely thought of as spatial or urban elements. Is it possible to create spaces for counter-map amplification? In the project Anti-Eviction House, the Clarion Alley Mural Project teamed up with the local community (the central part of the project was based on the construction of digital maps) to paint a 20-foot large mural in San Francisco that rendered one of the digital maps. Space next to the mural became a meeting point to listen to each other and discuss. The mural became part of the city, an urban element to interact with, and which reinforced community links. The counter-map displayed space but also produced it.
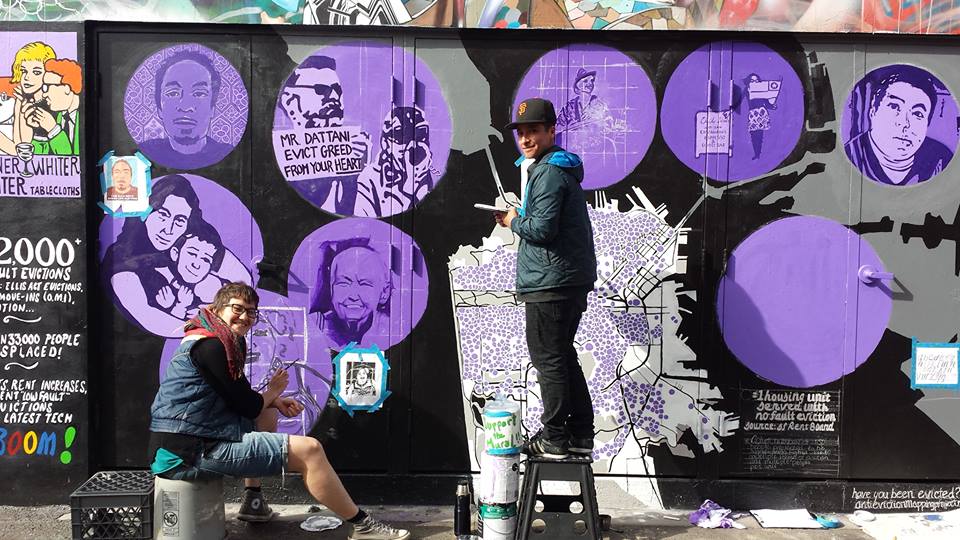
Fig. 3.3: Anti-eviction mural in San Francisco.
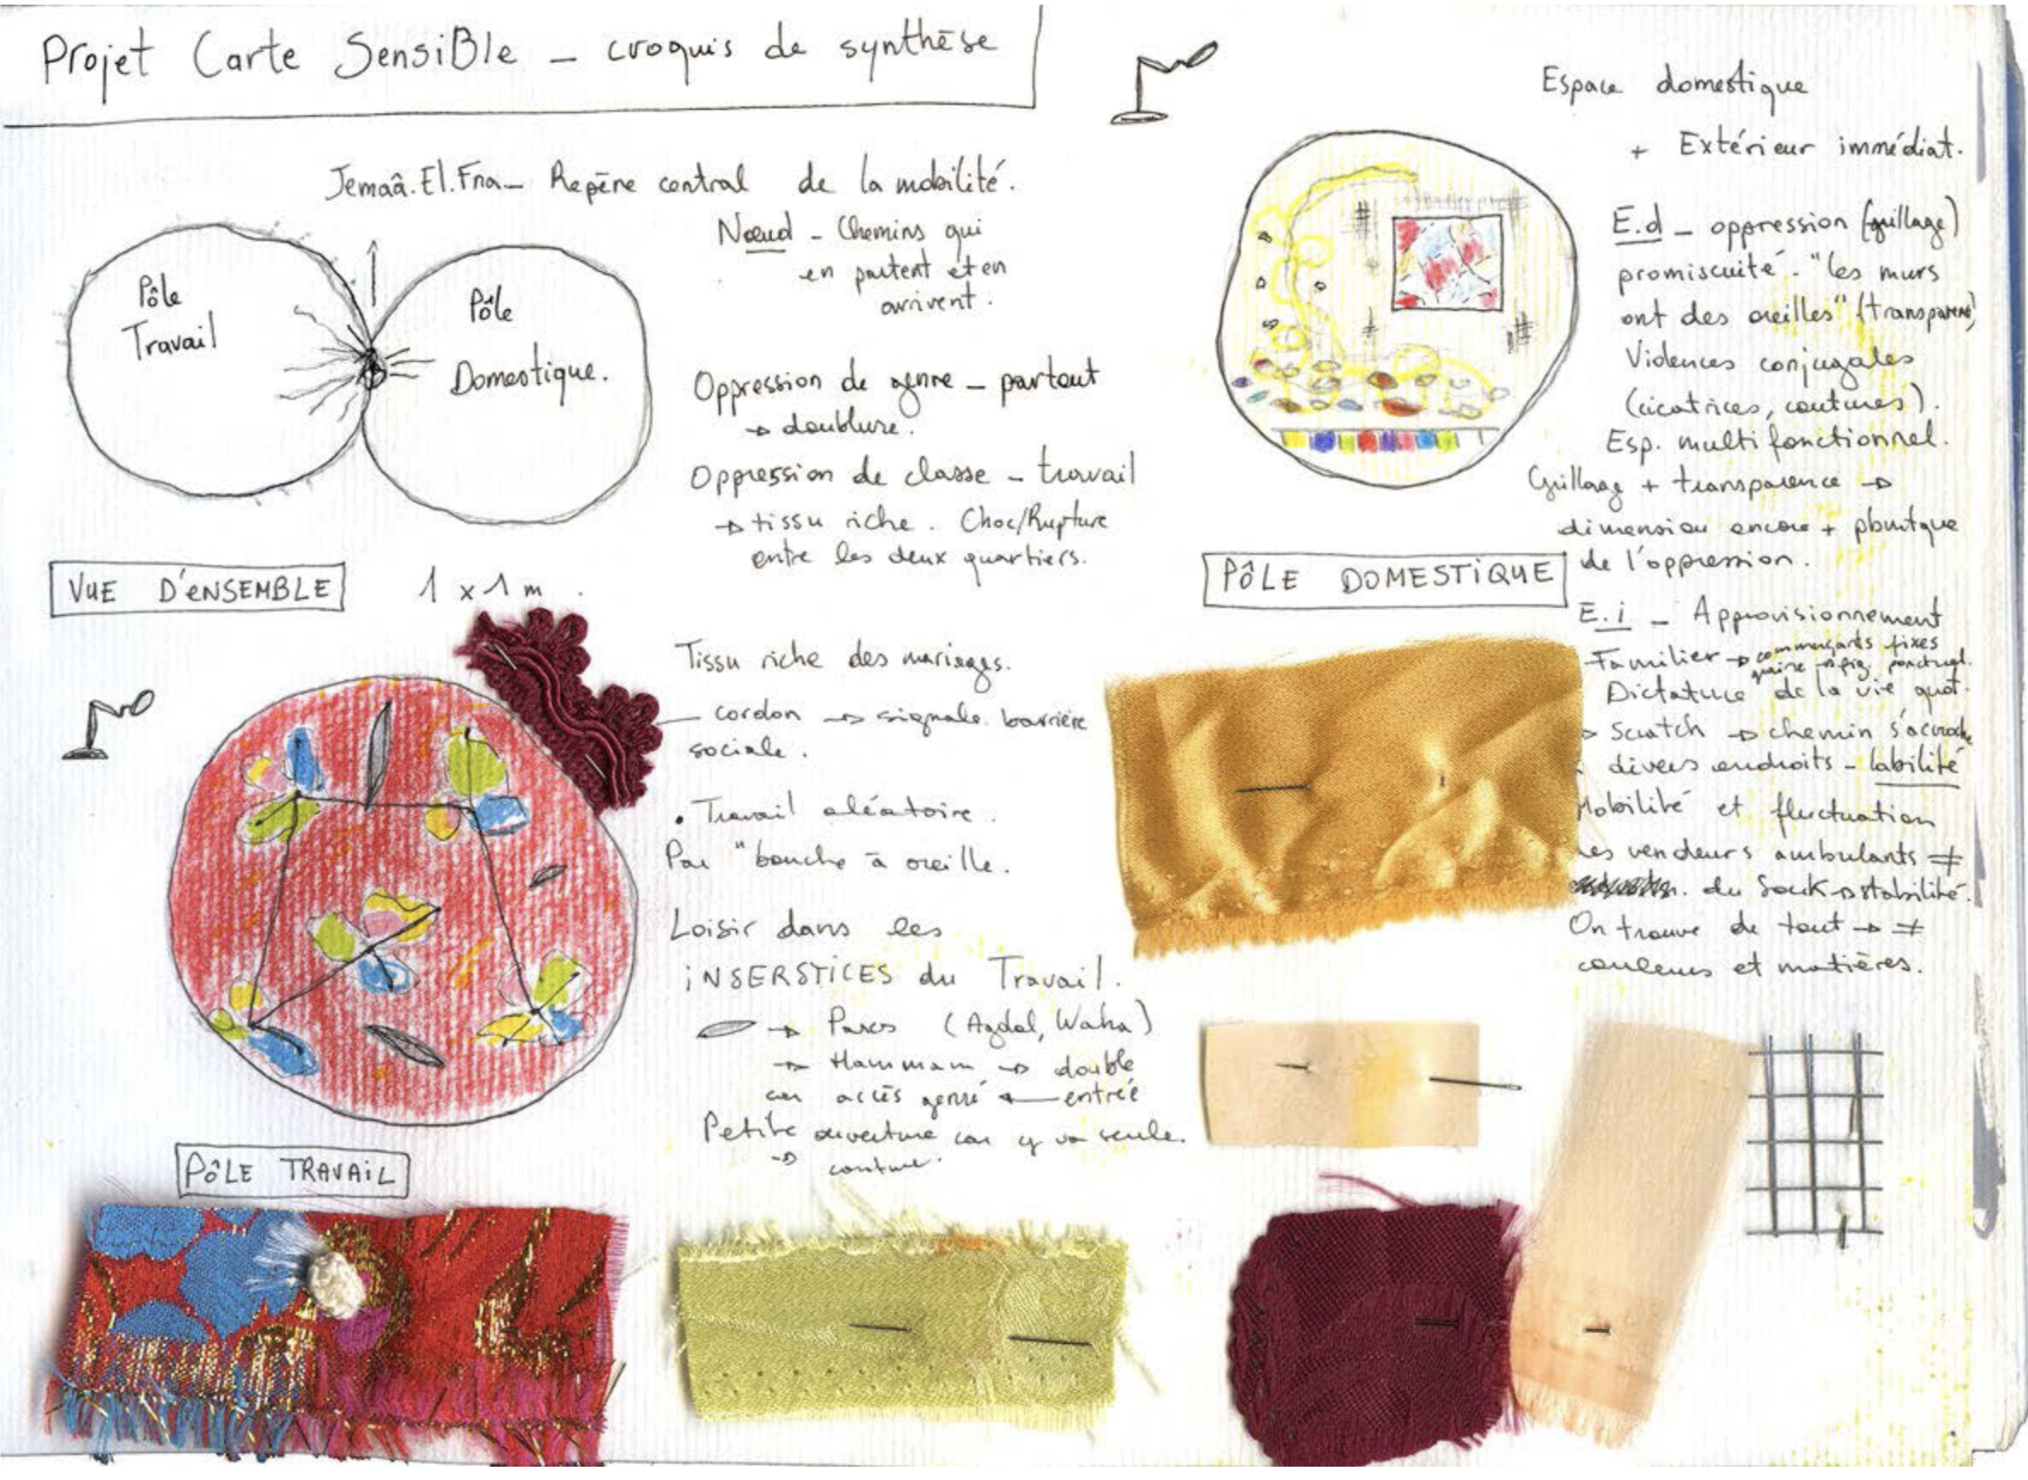
Fig. 3.4: Notes for creating textile maps in Marrakech, 2010.
“Cartography does not merely represent, but rather generates something that results from the involved persons’ relation” (Olmedo, 2016). Cartographies tend to be elements perceived by our visual conception, but can we complement this to include new senses and strategies for cartographic communication? The project Textile Maps explores the introduction of tactile sensitivity in the production of geographical knowledge. This collective project, developed by a community of women in Morocco, visualises the relationship between the women of Sidi Yusf and places where they live and work. They created a collection of textile maps, mixing vernacular and academic knowledge in the work which they described as “post-representational” and which was presented as a research object in its own right. The map is created and read using tactile language. The mapmakers sew and embroider, and the readers touch and manipulate the map in order to translate it. Textile maps demand the involvement of the body in producing, perceiving, and understanding geographical knowledge, making the reader a dynamic and sensitive participant.
An open-access publication
The ambition of counter-maps is to spread, reveal, and visualise knowledge that is not regularly accessible by citizens. Therefore, their accessibility is a crucial point in their dissemination process. They contribute to public knowledge; not only in terms of making information available, but also making it readable and understandable, with open access as a fundamental principle.
Following this assumption, the project This Land Is Our Land (597 Acres) converted open data in open space in New York City. The goal of the project was to inform citizens about vacant property owned by the government in the city, encouraging them to open up these spaces to be used as public green spaces. First, the project fought to transform data about property owners in New York City into public and open information, because citizens deserved to have this information. Then, when the data was available in open online portals and maps, the project focused on making it even more accessible to people. To achieve this goal, signs and posters were installed on the fences of the empty plots, welcoming citizens to use these spaces that were already public (government ownership), though they simply didn’t know this yet. This action resulted in a community-based control of physical space and more than 20 successful new public green spaces thanks to accessibility and visibility of information.
Maps are accessible when we can read the information that is on them, but does open access imply that we can also appropriate and reproduce their content? Media (visual and information products) are, by default, subject to market and property logic, so technically and legally, they can be viewed but not shared. Counter-cartographies, where open and free access and reproduction can be helpful in the dissemination process, frequently use legal tools to permit this reproduction. Applying licenses such as Creative Commons or copyleft allows for a redefinition of the default copyright model. Understanding counter-maps as open documents is a powerful strategy to reach more people. The Argentinian duo Iconoclasistas describe their process of dissemination as follows:
“We shared our resources and practical experience on our website to not only set them free from barriers of private property but also economic, physical, and geographic restrictions. The website is multimedia support to spread and share the material we produce and to foster its appropriation through Creative Commons licenses. Resources uploaded to the web for reappropriation, reproduction and redefinition turn this virtual means into a collective tool through which hierarchies are dismantled and exchange is stimulated. In consequence, users become producers recurring to liberated production.”
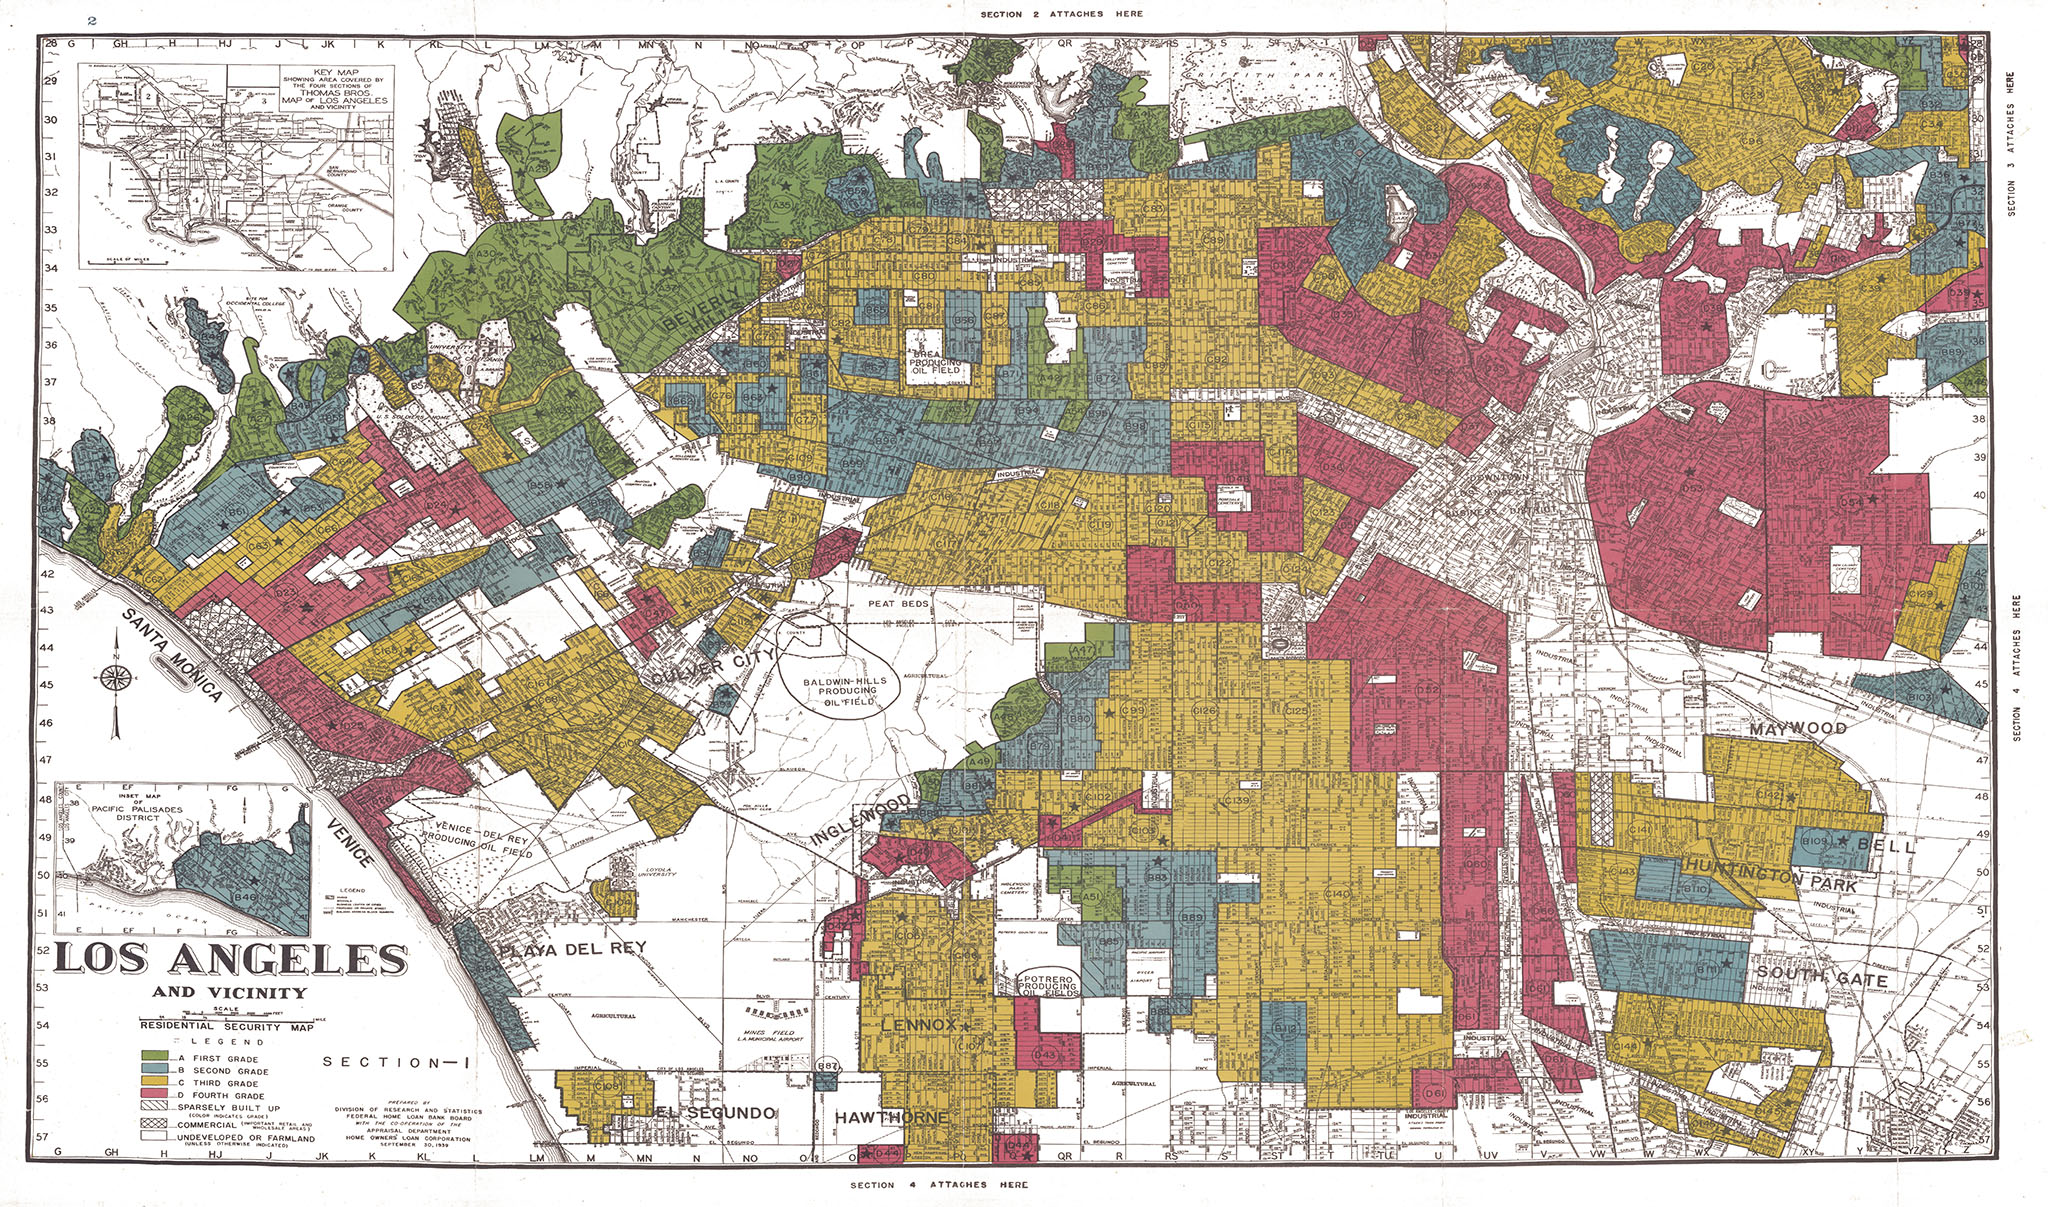
Fig. 3.5: Redlining map of Los Angeles, 1939.12
Nevertheless, the open nature of counter-mapping information and the encouragement of access, appropriation, and dissemination of maps can also imply risks. While many counter-maps have been successful in making a difference, good intentions can gravely backfire (Bliss, 2019). If a counter-map represents poverty or people at risk of exclusion, it is also outlining areas of vulnerability. This action can be beneficial for social and urban actions. Still, in the hands of banks or economic power structures, this data could be used to “redline” that district (hinder access to housing and loans to an area due to its socio-economic information) or any other exclusion. In 2016, the non-profit Greater London Authority (GLA) created a map that identifies and categorised “rough sleepers”. Sensitive information such as the nationality, mental health and gender of individuals was collected and mapped. This data was used by many charities and agencies in order to support these people and identify emerging needs. However, the Home Office secretly acquired this information and used it to target non-U.K. homeless people and deport them, completely changing the goal of the map. Thus, accessibility of information in counter-maps implies an act of responsibility that allows access to information, but also guarantees the safety of what is being represented. Effective safety mechanisms include ensuring the accuracy of the data that is published, its anonymity, or the medium through which it is spread.
Social legacy: footprints of counter-maps
An effective counter-cartography leaves footprints throughout society which stay longer than the document itself. A counter-map that is forgotten as a visual element, but whose result is reflected in society, has fulfilled its social function and can be considered successful. We can draft three main strategies to disseminate the legacy of counter-maps in society and allow this legacy to remain in the long term: transforming maps into political actions, transforming maps into educational tools, and urban design improvements.
Counter-maps trigger calls for action and social movements that generate political pressure. These mobilisations, when heard by the right people, can unleash authentic political actions that effectively improve the quality of life of citizens. Even though counter-maps have often been considered a way of “governance without government”, their power and effectiveness are significantly increased when their legal recognition is pursued, in an attempt to generate new laws, improved social allowances, or other social resources.
Education is one of the fundamental pillars of society. Maps and cartographies are commonly used in the education process. They are fruitful elements to teach how we understand the space and the world. They are significant pieces in the constitution of our morals, thoughts, and standards. Counter-maps which achieve an educational role, become part of a reader’s knowledge for a long time, not as an imposition but as a reflective motivation that invites us to think about divergent realities and how to approach them.
Maps and urban scenarios are strongly connected. Counter-maps are extraordinarily powerful and efficient elements for metropolitan revitalisation. Architects and urban designers play an essential role in the development and interpretation of counter-maps. Cartographies can become tools for identifying potential urban conflicts and drafting solutions, which architects and designers can match through design and strategic urban decisions. Good urban design listens to the people who will be using the design, in order to improve their life, their experience, and their perception of space – three crucial issues represented in counter-maps.
Conclusion
Since I started writing this thesis, I have become a counter-cartographer. There is no degree required, not even any technical capabilities, but only a high motivation to make social improvements and an exploratory attitude of new social and urban models. Mapping is intrinsically a political act that forces you to redefine realities and to understand and approach social phenomena. Being a counter-cartographer means looking for motivations around you, and setting a clear objective in which maps will become a useful element of social development.
As an architect, I am very familiar with the real estate market, and I have developed a particular interest in the social consequences of its current situation and potential variations. Furthermore, growing up in Europe, I have seen with great frustration how the economy and social rights were devoured by major crises with their origin in real estate speculation. The social consequences of this speculation can be pernicious to society if there is no awareness of its impact, such as gentrification, exclusion from the housing market, redlining, etc. – however, this does not appear on the “official” housing maps, that proudly show how house prices are increasing, thus apparently demonstrating that the economy is growing every day, and trying to frame the perfect moment to invest in the most valuable property. But are there sustainable housing alternatives outside the standardised housing model in Europe? How do people survive unstoppable house speculation?
These questions motivated me to start the project Cartographies of Counter-Speculation in parallel with this thesis. The project explores how maps can be useful tools to understand, visualise and empower social processes of developing alternative and experimental housing models in Rotterdam. From micro-economic maps that envision how to create sustainable monetary models, to sociocratic diagrams that show the human relations that communities manage in order to create their own structures, this project conveys a critical thought of those urban and social strategies that are at the margins of the huge phenomenon of real estate.
This thesis gave me the foundations of the process of creating counter-maps. Counter-cartographies are design elements in which you can make your own rules and your own new visual codes in order to keep them active and democratic. The process of map-making became a collection of different participatory techniques (meetings, map-making sessions, feedback, and peer-to-peer reviews) where knowledge of the population could be extracted, understood, and tracked – but also a process of looking for improvised map-makers that could complement and enrich the collection. A map is powerful when it becomes a useful and effective item, and when it circulates. Therefore, these maps, developed initially with communities within the city of Rotterdam, were translated into a collection of tactical cartographies, which can be understood as a strategic compilation of maps meant to reproduce, inspire or complement these alternative practices to real estate speculation in different cities where the housing market is being challenged.
“Cartographies of Counter-Speculation” is just one small contribution to this over-mapped Earth where everything we do is registered and tracked. Cartographies and maps are undoubtedly an essential part of our life. We have become familiar with them. Precisely because of this globalisation of maps, now is the right moment to work with them; they are effective, understandable and accessible. The world is changing, and the way we understand these changes is itself creating new realities. Mapping is part of this process: maps are products of the world, and they produce the world. Such changes demand a new manifesto – new ways of thinking, researching and creating maps (Kitchin, Dodge and Perkins, 2011). Our environment is already mapped, but are these maps the ones we want? Counter-cartographies are not only about representing the territory, but also about creating desired worlds. If a counter-cartography can trigger social progress, then the making of one more map in our already extensively mapped world has been a worthwhile endeavour.
Endnotes
-
This may be the first world map printed in Europe (1475). The world map in the Rudimentum visualises inhabited lands and pictures them as a circle surrounded by the ocean. The circular representation is divided by continents: the top half of the map represents Asia, the lower left Europe, the lower right Africa. Judea and Palestine occupy the centre of the circle representing the Holy Land. ↩
-
Dating from between 1578 and 1586, the Cempoala map is part of the Relaciones Geográficas collection that represents Spanish-held territories in the Americas. ↩
-
Appeared in An Atlas of Radical Cartography (Mogel and Bhagat, 2007). Through the distribution of this map and its unconventional location of the words “Latino/a” and “America” the artist aims to challenge “what ‘America’ means, and what it means to be ‘American’.” Source: artist’s website. ↩
-
The map is an ocean chart owned by the Bellman – one of the main characters in the book – that helps him and his fellow adventurers cross the ocean and arrive at a strange land. The absurdity of the map is that it only shows ocean, literally illustrating nothing, and therefore cannot be a very effective navigating tool. ↩
-
This representation was developed by Pablo de Soto as part of the art/activist collective Hackitectura. ↩
-
The Naked City represents the city of Paris from the eyes of the Situationist technique of “dérive” or drift, where connections are established based on the behaviour of a person walking aimlessly in a city. ↩
-
Christian Nolde makes maps using the Google API to try to show the emotions people experience when they travel through a certain urban landscape. To do this, it uses GPS, galvanic skin response meters, recorders, mobile phones and digital cameras. ↩
-
In 2014, after the kidnapping of an Israeli soldier by Hamas, the 2014 Gaza War resulted in four days of bombardments, during which more than two thousand homes were destroyed. Amnesty International and Forensic Architecture (FA) were denied entry into the Gaza strip. Therefore they relied on the collective intelligence of the people who were there to develop the collaborative map The Bombing of Rafah. They collected thousands of images and videos and reconstructed the bombing disaster linking all these images and videos through a virtual map. ↩
-
“Produced, drawn, written and researched by villagers, the Bonsall Map is a celebration of our village’s unique history, and a richly layered document, highlighting not only the topography of the parish, but, in a series of articles on the back, its geology, natural history, its past as a lead mining village, its businesses past and present including farming, buildings, pigeon racing, carnival and well dressing, and present-day facilities.” Source: bonsallhistory.org. ↩
-
In the last fifteen years, many Latin American cities have undergone progressive urban transformations – engaging violence, conflict and socio-economic inequality while rethinking public policy and urbanisation. The city of Medellín, Colombia, is a powerful example of a radically restructured civic domain. Medellín reimagined infrastructure, housing, and density, developing new forms of public management to mediate top-down development and bottom-up social organisation. ↩
-
Balloon mapping was developed by Public Lab, an open network of community organisers, educators, technologists and researchers founded in 2010 as an open source, grassroots data-gathering and research initiative. ↩
-
This map of Los Angeles ranks neighbourhoods by desirability, as determined by the Home Owners’ Loan Corporation (HOLC). The scale from most to least desirable goes from green to blue to yellow to red. HOLC maps generally rated poorer or less white neighbourhoods as less desirable. This information, known as “redlining”, was used by banks and powerful corporations to ban access to loans by certain people attempting to live in an area defined as “red”. ↩
References
-
Berwick, C., 2010. Remaking the Map. ARTnews, [online]. Available at: https://www.artnews.com/art-news/news/remaking-the-map-345/ [Accessed 10 April 2020].
-
Blazquez, O., 2018. Collaborative Cartographies: Counter-Cartography and Mapping Justice in Palestine. Journal of Holy Land and Palestine Studies, pp. 75-85. Edinburg: Edinburg University Press.
-
Bliss, L., 2019. MapLab: The Power of Counter-Maps. Citylab, [online]. Available at: https://www.citylab.com/newsletter-editions/2019/12/maplab-power-counter-maps/602968/ [Accessed 02 April 2020].
-
Caquard, S., 2014. Cartography II: Cartographies in the Social Media Era. Progress in Human Geography, [e-journal] 38(1), pp. 141-150. https://doi.org/10.1177/0309132513514005.
-
Cobb, J., 2015. The Past Haunts at the Periphery. The New Yorker. [online]. Available at: https://www.redlinearchive.net/archives/ [Accessed 02 April 2020].
-
Collective, C. C., Dalton, C. and Mason-Deese, L (2012). Counter (Mapping) Actions: Mapping as Militant Research. ACME: An International E-Journal for Critical Geographies, [e-journal] 11(3), pp. 439-466. Available at: https://acme-journal.org/index.php/acme/article/view/941 [Accessed 12 May 2020].
-
Crampton, J., 2001. Maps as Social Constructions: Power, Communication and Visualization. Progress in Human Geography, [e-journal] 25(2), pp. 235-252. https://doi.org/10.1191/030913201678580494.
-
Cruz, T. and Forman, F., 2019. The Medellín Diagram. In: P. Dávila, ed. 2019. Diagrams of Power: Visualizing, Mapping and Performing Resistance. Eindhoven: Onomatopee 168. pp. 119-131.
-
Dear, M., 2011. Creative places: Geocreativity. In: M. Dear, J. Ketchum, S. Luria, D. Richardson eds. 2011. GeoHumanities. London: Routledge. pp. 5-7.
-
Drucker, J., 2014. Graphesis Visual Forms of Knowledge Production. Cambridge, Massachusetts: Harvard University Press.
-
Funtowicz, S. O., and Ravetz, J. R., 1993. Science for the post-normal age. Futures, [e-journal] 25(7), pp. 739-755. https://doi.org/10.1016/0016-3287(93)90022-L.
-
Harley, J. B., 1989. Deconstructing the Map. Cartographica: The International Journal for Geographic Information and Geovisualization, 26 (2), pp. 1-20.
-
Harris, M., and Hazen, H., 2005. Power of Maps: (Counter) Mapping for Conservation. ACME. 4(1): 99-130.
-
Holmes, B., 2004. Imaginary Maps, Global Solidarities. 16 Beaver, [online]. Available at: http://16beavergroup.org/articles/2004/04/16/rene-holmes-imaginary-maps-global-solidarities/ [Accessed 05 May 2020].
-
Ketchum, J., 2011. Visual Geographies, Geoimagery. In: M. Dear, J. Ketchum, S. Luria, D. Richardson eds. 2011. GeoHumanities. London: Routledge. pp. 139-142.
-
Kitchin, R.; Dodge, M. and Perkins, C., 2011. Introductory Essay: Power and Politics of Mapping. The Map Reader: Theories of Mapping Practice and Cartographic Representation, pp. 387-394. https://doi.org/10.1002/9780470979587.ch50.
-
Lin, W., 2010. Counter-cartographies. In: P. Cloke, P. Crang, M. Goodwin, eds. 2013. Introducing Human Geographies. 3rd edition. Abingdon, Oxon: Routledge. Ch.15.
-
Luv, C. and Radburn, R., 2018. Making the invisible visible. Medium, [online]. Available at: https://medium.com/@databeats/making-the-invisible-visible-7c84094b0193 [Accessed 05 May 2020].
-
McCarthy, T., 2014. Introduction. In: H. Ulricht, ed. 2014. Mapping it out. London: Thames & Hudson LTD. pp. 06-10.
-
Mesa del Castillo, M., 2012. Víctimas de un Mapa. Ph. D. Universidad de Alicante.
-
Mesquita, A., 2016. Counter-Cartographies: Politics, Art and the Insurrection of Maps. In: K. Orangotango, ed. 2018. This is not an Atlas. Translated from Portuguese by T. Bartholl. Bielefeld: Transcript Verlag. pp. 26-31.
-
Morris, D. and Voyce, S., 2015. Avant-Garde, III: Situationist Maps, Take One. Jacket2, [online]. Available at: https://jacket2.org/commentary/avant-garde-iii-situationist-maps-take-one [Accessed 05 May 2020].
-
Moss, O., Irving, A., 2018. Imaging Homelessness in a City of Care. In: K. Orangotango, ed. 2018. This is not an Atlas. Bielefeld: Transcript Verlag. pp. 270-275.
-
Nietschmann, B., 1994. Defending the Miskito Reefs with maps and GPS: Mapping with sail, scuba, and satellite. Cultural Survival, [online]. Available at: https://www.culturalsurvival.org/publications/cultural-survival-quarterly/defending-miskito-reefs-maps-and-gps-mapping-sail-scuba [Accessed 20 April 2020].
-
Olmedo, E., 2016. Cartographies Textiles: Expérimentations de cartographie sensible dans le quartier de Sidi Yusf. Translated from French by S. Fraine. Paris: UMR Géographie-cités.
-
Parker, B., 2006. Constructing Community Through Maps? Power and Praxis in Community Mapping. The Professional Geographer, [e-journal] 58(4), pp. 470-484. https://doi.org/10.1111/j.1467-9272.2006.00583.x.
-
Pater, R., 2016. The Politics of Design: A (Not So) Global Manual for Visual Communication. Amsterdam: BIS Publishers.
-
Perkins, C., 2007. Community Mapping. The cartographic Journal, [e-journal] 44(2), pp. 127-137. https://doi.org/10.1179/000870407X213440.
-
Rekacewicz, P. 2019. Angry Maps. In: P. Dávila, ed. 2019. Diagrams of Power: Visualizing, Mapping and Performing Resistance. Eindhoven: Onomatopee 168. pp. 96-109.
-
Savage, S., 2016. What’s in a Map? Greening Bourj Al Shamali, [online]. Available at: https://assemblepapers.com.au/2017/05/12/whats-in-a-map-greening-bourj-al-shamali/ [Accessed 12 May 2020].
-
Scott, E., 2011. Undisciplined geography: Notes from the field of contemporary art. In: M. Dear, J. Ketchum, S. Luria, D. Richardson eds. 2011. GeoHumanities. London: Routledge. pp. 50-60.
-
Turnbull, D. and Watson, H., 1993. Maps Are Territories: Science Is an Atlas. Chicago: University of Chicago Press.
-
Vossoughian, N., 2011. Otto Neurath: the language of the global polis. Rotterdam: Nai Publishers.
-
Watson, R., 2009. Mapping and Contemporary Art. The cartographic Journal, [e-journal] 46(4), pp. 293-307. https://doi.org/10.1179/000870409X12549997389709.
-
Wood, Denis., 2010. Rethinking the Power of Maps. New York: Guilford Press.
Images
-
Fig. 0.1: Brandis, L., 1475. Rudimentum Novitiorum [image]. Available at: https://www.flickr.com/photos/quadralectics/8499408431/
-
Fig. 0.2: Unknown., 1580. Cempoala [image]. Available at: https://geofbric.tumblr.com/page/2
-
Fig. 0.3: Lasch’s, P., 2003. Latino/a America [image]. Available at: https://www.pedrolasch.com/latinoaamerica.html#en
-
Fig. 1.1: Carroll, L., 1876. Map of Nothing [screenshot by author]. The Hunting of the Snark. Macmillan.
-
Fig. 1.2: Torres, J., 1943. América Invertida [screenshot by author]. Museo Juan Manuel Blanes, Montevideo.
-
Fig. 1.3: Unknown., 1929. The Surrealist Map [screenshot by author]. In: Rethinking the Power of Maps, p. 198.
-
Fig. 1.4: Mogel, L., 2008. Mappa Mundi [screenshot by author]. In: GeoHumanities, p. 191.
-
Fig. 1.5: Hackitectura., 2004. Critical Cartography of Gibraltar [image]. Available at: https://pablodesoto.org/radical-cartography/critical-cartography-of-the-straits-of-gibraltar/
-
Fig. 1.6: Kahn, F., 1926. Der Mensch als Industriepalast [screenshot by author].
-
Fig. 1.7: Neurath, O. (n.d.). The Great War [image]. Available at: http://www.laworrell.com/blog/2015/1/14/isotype-international-system-of-typographic-picture-education
-
Fig. 1.8: Bureau d’Études, 2013. World government [screenshot by author]. In: This is not an Atlas.
-
Fig. 1.9: Debord, G., 1957. The Naked City [image]. Available at: https://paulwalshphotographyblog.wordpress.com/2013/07/08/the-naked-city/
-
Fig. 1.10: Fahlström, Ö., 1972. World Map [screenshot by author].
-
Fig. 1.11: Lombardi, M., 1999. World Finance Corporation and Associates [image]. Available at: https://www.artribune.com/attualita/2011/05/ma-perche-la-geografia-non-interessa-a-nessuno/attachment/04-mark-lombardi/
-
Fig. 1.12: Nold, C., 2005. Greenwich Emotion Map [image]. Available at: http://www.softhook.com/emot.htmW
-
Fig. 2.1: Forensic Architecture., 2015. Reconstructed bomb Rafah [image]. Available at: https://forensic-<architecture.org/investigation/the-bombing-of-rafah>
-
Fig. 2.2: Unknown, 2009. Tracking Jesusita Fire [image]. Available at: https://latimesblogs.latimes.com/lanow/2009/05/track-the-jesusita-fire-on-latimescom.html
-
Fig. 2.3: Unknown, 2007. Bonsall Parish Map Excerpt [image]. Available at: https://www.researchgate.net/publication/233633970_Community_Mapping
-
Fig. 2.4: Cruz, T. and Forman, F., 2016. The Medellín Diagram [screenshot by author]. In: Diagrams of Power.
-
Fig. 2.5: Unknown., 2016. Balloon mapping guide [screenshot by author]. Available at: https://bourjalshamali.org/2016/10/12/balloon-mapping-guides-in-arabic-and-german/
-
Fig. 3.1: Koláčný, 1969. Map Communication Model [screenshot by author]. Available at: https://www.researchgate.net/publication/328642913_Form_Follows_Feedback_Rethinking_Cartographic_Communication/figures?lo=1
-
Fig. 3.2: Mogel, L. (n.d.). NY City Supply Human Diagram [image]. Available at: https://www.cmu.edu/cas/events/2018-19/fall/counter-cartographies.html
-
Fig. 3.3: Unknown, 2015. Mural in Clarion Alley [photograph]. Available at: https://antievictionmappingproject.wordpress.com/about/
-
Fig. 3.4: Olmedo, E., 2010. Textile maps in Marrakech [image]. Available at: https://notanatlas.org/de/textile-maps-2/
-
Fig. 3.5: Unknown, 1939. Redlining Map of central Lon Angeles [map]. Available at: https://www.kcet.org/shows/lost-la/segregation-in-the-city-of-angels-a-1939-map-of-housing-inequality-in-la